Figure 1.
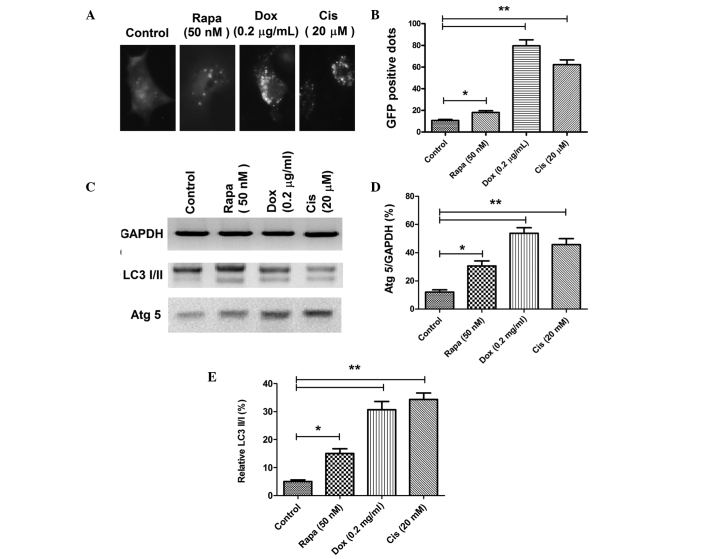
Autophagy was induced during chemotherapy in osteosarcoma cells. (A) LC3 punctas in Saos-2 cells following chemotherapy. (B) Quantitative analysis of the punctate GFP-LC3 dots in Dox- or Cis-treated Saos-2 cells. (C) Western blotting of Atg 5 and LC3-I/II in Dox- or Cis-treated Saos-2 cells; (D) Relative expression of Atg 5 to GAPDH in Dox- or Cis-treated Saos-2 cells; (E) Relative expression of LC3-II to LC3-I in Dox- or Cis-treated Saos-2 cells.. Data were normally distributed. The difference between two groups in the GFP-positive dots, the relative expression of Atg 5 and LC3-II/I was analyzed using the Student-Newman-Keuls test. Independent experiments were performed in triplicate. *P<0.05 and **P<0.01, vs. control. GFP, green fluorescent protein; Dox, doxorubicin; Cis, cisplatin; Atg5, autophagy protein 5.

