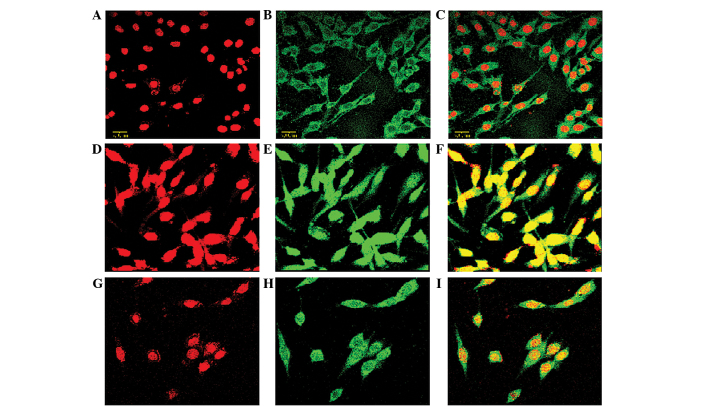
Figure 2.
Neuron-like PC12 cells exhibited (A-C) round, red fluorescent areas (as shown by PMT1) and (D-F) green fluorescence representing p65 protein (as shown by PMT2). (G-I) Overlay of the PMT 1 and 2 images showed complete cell sections exhibiting a red nucleus and a green cytoplasm. (D) In the PTZ group, including the blank, missense NF-κB decoy ODN and NF-κB decoy ODN subgroups, PMT 2 showed that the whole cell exhibited green fluorescence and the intensity of green fluorescence was higher in the nucleus compared with the cytoplasm; (E) in the control group, including the blank, missense NF-κB decoy ODN and NF-κB decoy ODN subgroups, PMT 2 showed that green fluorescence was mainly distributed in the cytoplasm; (G-I) overlay of the cell images showed that the intensity of green fluorescence in the red fluorescent nuclear area of the PTZ group was significantly higher than that in the control group. PTZ, pentylenetetrazol; NF-κB, nuclear factor κ B; ODN, oligodeoxynucleotide, PMT, photomultiplier tube.

