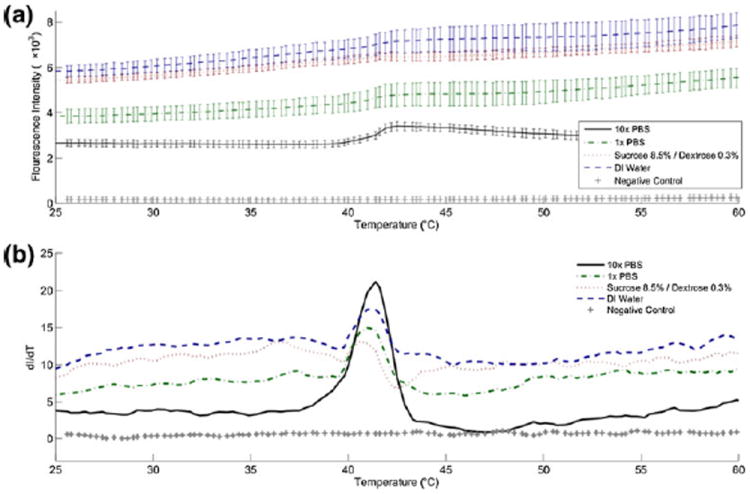
Fig. 3.

Liposomes encapsulating calcein were prepared, re-suspended in various media and analyzed with a melting curve program in a realtime PCR instrument. The sample temperature was increased from 25 °C to 95 °C over 30 min and at 520 nm emission was monitored throughout. (a) Raw fluorescence intensity and (b) the rate of change dI/dT versus temperature show that a dramatic increase in fluorescence intensity occurs at approximately 41°, indicating the release of calcein from within liposomes. This agrees with the lipid transition temperature cited by the product literature
