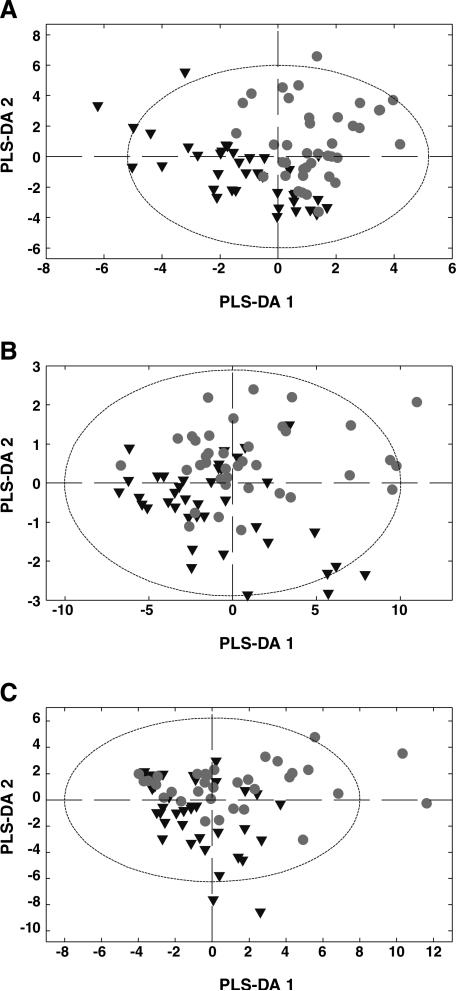
Fig. 2.
Global metabolite comparison of tissues sampled. The figures show the lines of control mice as one group (filled circles) and the lines of high-MMR mice another group (filled upside-down triangles) to make the data easier to visualize. (A) Gastrocnmeius muscle PLS-DA model is constructed from 30 metabolites. (B) Liver PLS-DA model is constructed from 42 metabolites. (C) Plantaris muscle PLS-DA model is constructed from 34 metabolites. Ellipse represents the 95% confidence interval.

