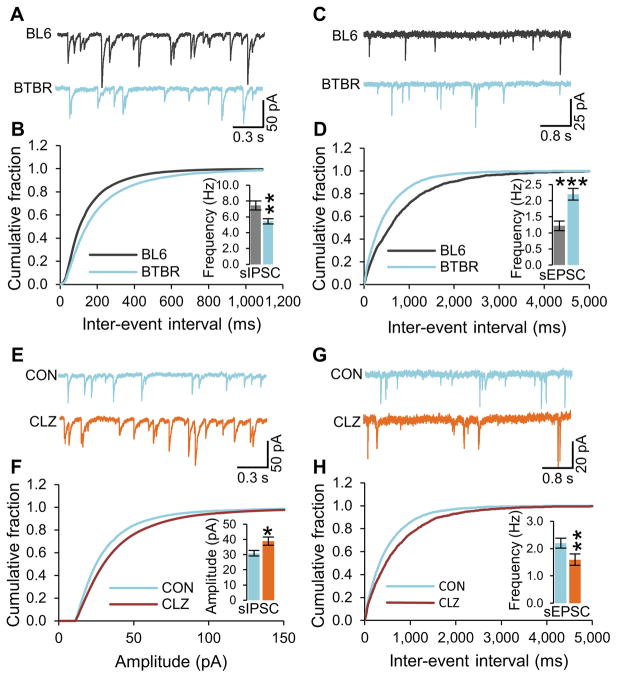
Figure 1. Reduced GABAergic neurotransmission in BTBR mice and enhancement by clonazepam.<.
br>Spontaneous IPSC (sIPSC) and sEPSC were recorded in the hippocampal slices from 3-week old male BTBR and C57Bl/6J mice. (A and B) Example traces of sIPSC (A) and cumulative plot and average values (inset) of sIPSC frequency in BTBR and C57BL/6J hippocampal CA1 neurons (B).
(C and D) Example traces of sEPSC (C) and cumulative plot and average values (inset) of sEPSC frequency in BTBR and C57BL/6J hippocampal CA1 neurons (D).
(E and F) Example traces of sIPSC (E) and cumulative plot and average value (inset) of sIPSC amplitude (F) in clonazepam and vehicle treated BTBR CA1 slices.
(G and H) Example traces of sEPSC (G) and cumulative plot and average value (inset) of sIPSC frequency (H) in clonazepam and vehicle treated BTBR CA1 slices.
CON, Control. CLZ, Clonazepam. All data shown are means ± s.e.m. from 15 – 19 recordings per strain. *P < 0.05, **P < 0.01, ***P < 0.001.

