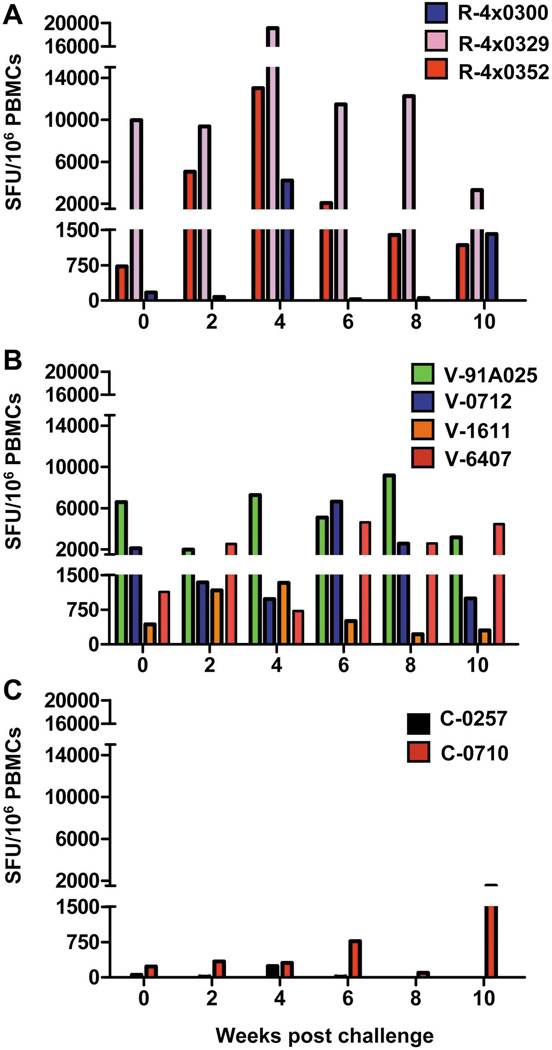
Figure 1. HCV ELIspot data and RNA levels in rechallenged (n=3), vaccinated (n=4) and control (n=2) chimpanzees.
Frequency of IFNγ-producing HCV-specific T-cells post challenge from peripheral blood mononuclear cells (PBMCs) isolated from chimpanzees included in this study. (A) Rechallenged animals, blue bars: R-4x0300, pink bars: R-4x0329, red bars: R-4x0352. (B) Vaccinated animals, green bars: 91A025, blue bars: V-0712, orange bars: V-1611, red bars: V-6407. (C) Control animals, black bars: C-0257, red bars: C0710. Cumulative counts are shown for responses against peptide pools representing NS3, NS4A, NS4B, NS5A and NS5B. ELIspot data for V-1611, V-6407 and C-0257 have been previously reported (12) and are included here for clarity.

