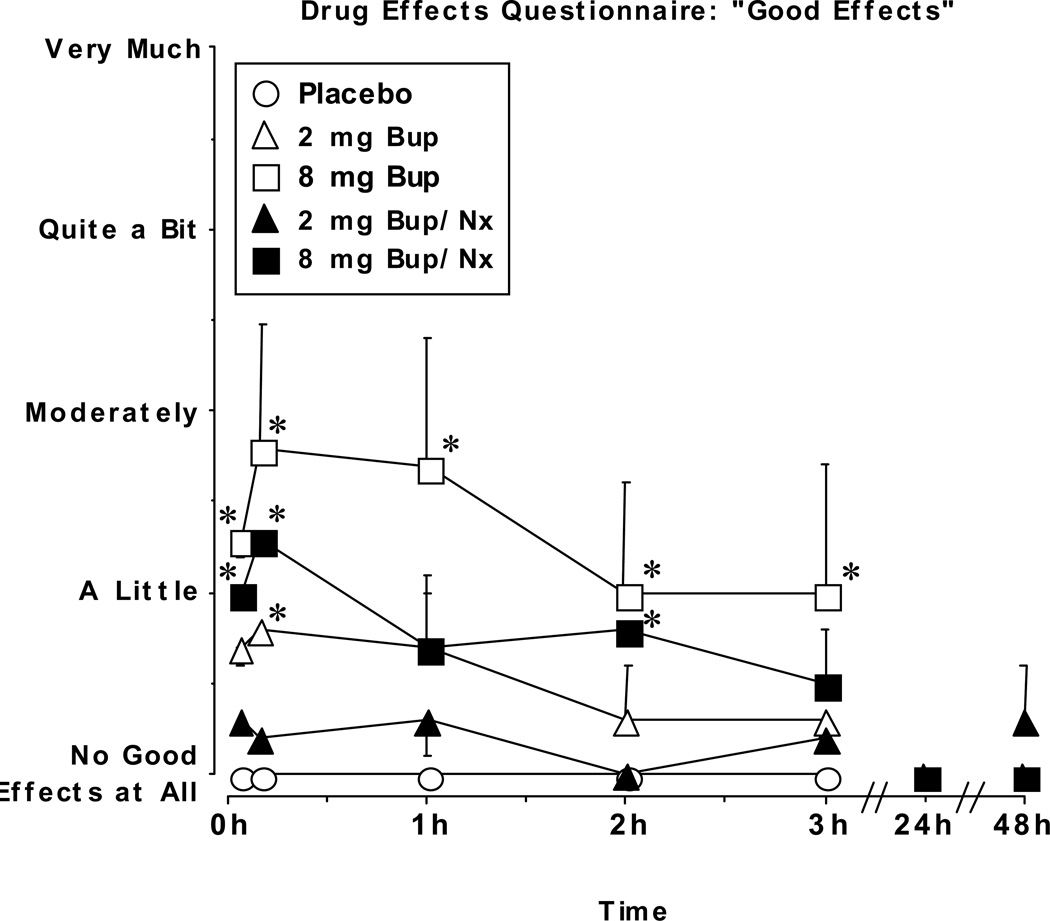
Figure 4.
Visual analog scale ratings of “Good Effects” during the sample and no drug sessions as a function of dose and time. Data points represent mean ratings for the 6 participants. Error bars represent ± 1 standard error of the mean (S.E.M.). * indicates significant differences from placebo at that time point (P<0.01). BL, baseline.

