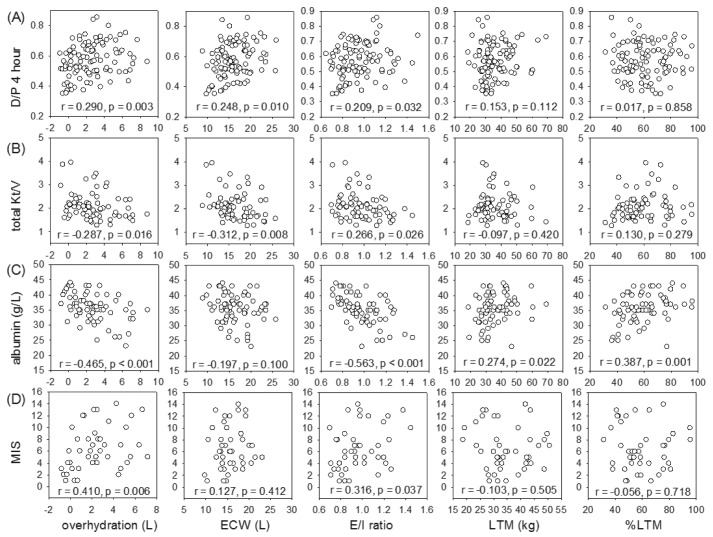
Figure 4 —
Relation between body composition parameters and (A) dialysate-to-plasma (D/P) creatinine ratio at 4 hours; (B) total weekly Kt/V; (C) serum albumin level; and (D) comprehensive malnutrition inflammation score (MIS). ECW = extracellular water; E/I ratio = extracellular-to-intracellular water ratio; LTM = lean tissue mass; %LTM = percentage of lean tissue mass. Data were compared by Spearman’s rank correlation coefficient. P values are adjusted for multiple comparison by the Bonferroni’s method.

