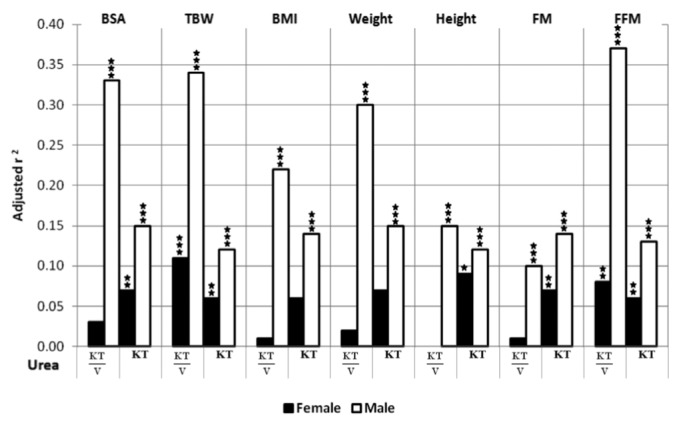
Figure 1 —

Adjusted r2 of multivariate linear regression for weekly, total urea KT/V and KT predicted by the model containing body surface area (BSA), total body water (TBW), body mass index (BMI), weight, height, fat mass (FM) and fat-free mass (FFM), separately, with adjustment to age, time on PD, mean protein intake and fluid schedule, in female and male patients (* p<0.05, ** p<0.01, *** p<0.001, where p values describe statistical significance of adjusted r2).
