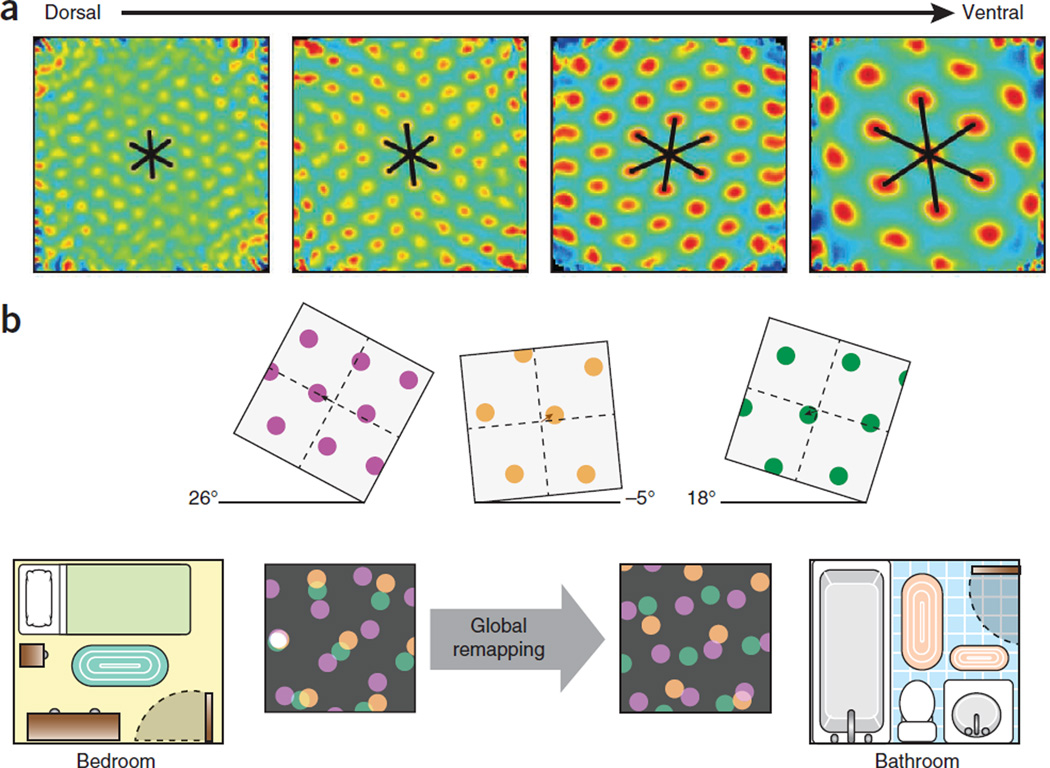
Figure 3.
Modular organization of the grid-cell network. (a) Stepwise increase of grid spacing at successive dorsoventral levels of medial entorhinal cortex. Spatial autocorrelograms for four example cells (one per dorsoventral module). (b) Remapping of hippocampal place cells in two environments. Top panels show responses of three grid cells to a change in the environment. Independent responses are illustrated by different degrees of rotation and translation. Bottom panels show inputs from the grid cells, each from a different module (purple, green and orange), at different locations in the environments. The three grid cells provide input to a particular CA3 cell (white spot at left) sufficient to cause it to fire when, and only when, the nodes of the three grids overlap. This occurs only at one location in this example. In the second environment, the altered coactivity of the grid cells activates a different subset of place cells at each location, and global remapping is observed in hippocampal place ensembles. Panel a reproduced with permission after ref. 32, b after ref. 33.

