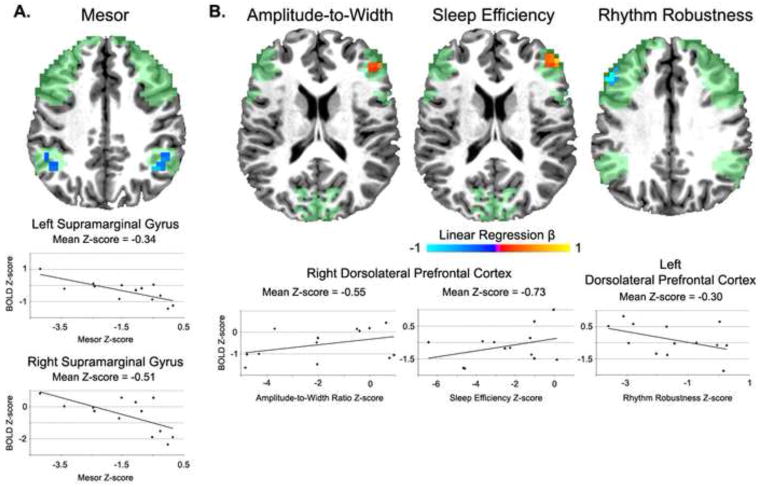
Figure 1.
Associations between circadian/sleep variables and brain functioning among euthymic bipolar I patients. The green regions represent the anatomical regions of interest where linear regression analyses were conducted. Panel A: Findings during the task encode interval. Panel B: Findings during the task maintenance interval. All clusters are significant at a corrected p < .05

