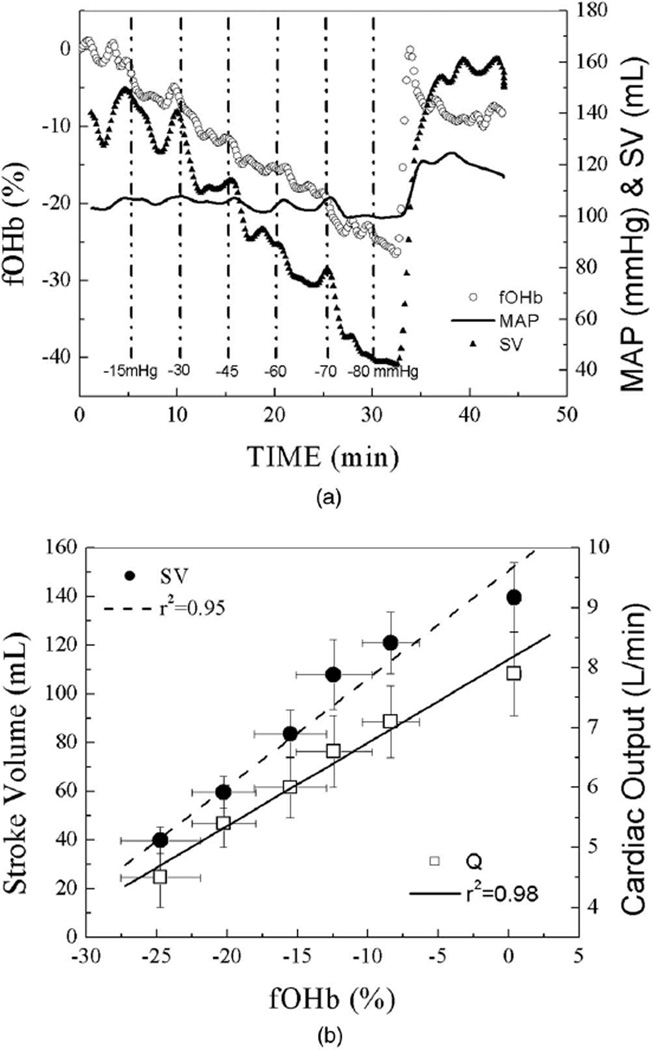
Fig. 5.
(a) Time course plots of DOS fOHb, mean arterial pressure, and stroke volume from a single subject (male, 24 yr, 191 cm, 73 kg). The subject experienced presyncope during a −80-mmHg LBNP. Dash-dot lines represent the time points where new LBNP levels were applied. Mean arterial pressure and stroke volume data points were extracted from a continual Finometer measurement, and synchronized with DOS fOHb data points for the illustrative comparison only. (b) Changes in stroke volume (left y axis) and cardiac output (right y axis) plotted against changes in fOHb during LBNP. Data represent the average values at specific LBNP levels and error bars represent standard errors. Data are from all ten subjects and are presented as mean±standard error (SE).

