
Figure 3. The role of Nrf2 in the protection against triptolide-induced cytotoxicity in HepG2 cells.
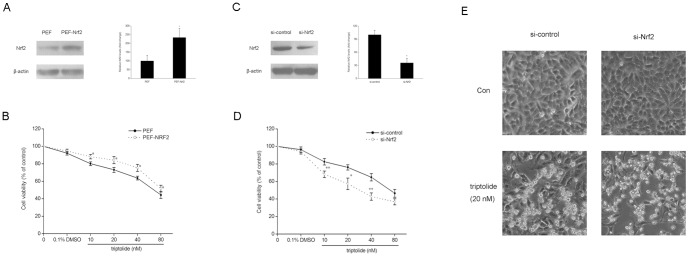
Overexpression experiments (A, B): HepG2 cells were transiently transfected with PEF or PEF_NRF2 plasmids. The cells were treated 24 h later with triptolide at various concentrations for 24 h. (A) Western blot analysis of Nrf2 expression 24 h after transfection. Expression of β-actin was used as an internal control. Representative blots from three independent experiments are shown. The density of the immunoreactive bands was analyzed, and the data are represented as the means ± SD. (B) Cytotoxicity was determined by an MTT assay. The data are represented as the mean ± SD from three independent experiments. Knockdown experiments (C, D, E): HepG2 cells were transiently transfected with control siRNA or siRNA targeting Nrf2. The cells were treated 48 h later with triptolide at various concentrations for 24 h. (C) Western blot analysis of Nrf2 expression 48 h after transfection. Expression of β-actin was used as an internal control. A representative blot from three independent experiments is shown. The density of the immunoreactive bands was analyzed, and the data are represented as the means ± SD. (D) Cytotoxicity was determined by an MTT assay. The data are represented as the mean ± SD from three independent experiments. (E) Morphological changes in normal and Nrf2 knockdown HepG2 cells treated with triptolide (20 nM) were observed under an inverted phase contrast microscope (100×, Olympus, Japan). The representative results from three independent experiments are shown. *P<0.05, **P<0.01 versus control cells treated with the same concentration of triptolide.