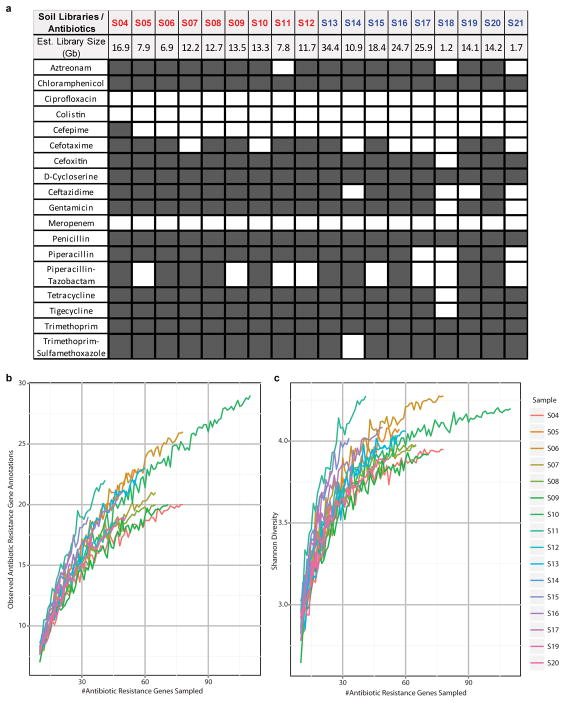
Extended Data Figure 1.
(a) Results of selections of 18 soil metagenomic libraries for antibiotic resistance to 18 compounds. A dark gray cell means a resistance phenotype was observed whereas white cells indicate the absence of any drug-tolerant transformants. Grassland soils from Cedar Creek (CC) are labeled in red and agricultural soils from Kellogg Biological Station (KBS) in blue. (b to c) Alpha diversity representations. On the left is depicted the number of distinct ARG annotations observed as increasing numbers of ARGs are sampled from each soil. On the right, Shannon diversity scores are shown at each rarefaction step.

