
Figure 3. Effects of transplantation of ES and iPS cells in Hes1 in DIC post-MI.
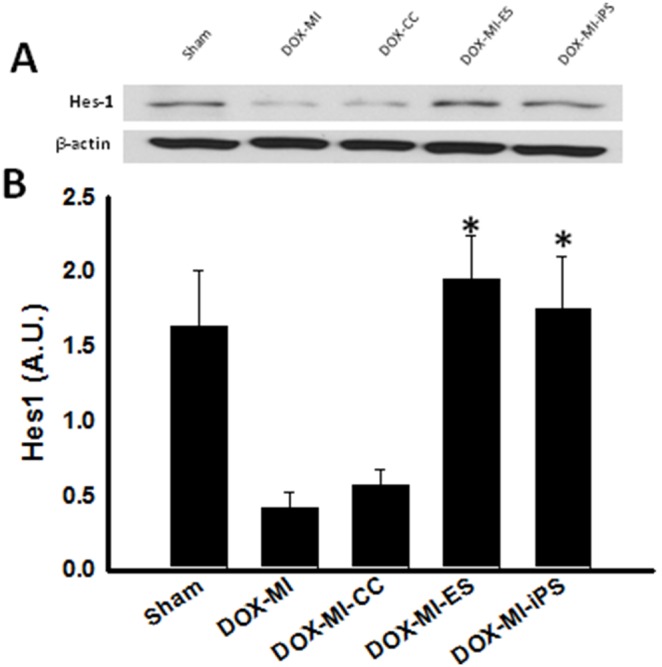
(A) Upper panel displays representative photomicrographs of WB bands of Hes1 and β-actin. (B) Bottom histogram shows densitometric analysis of WB bands with a significant increase in levels of Hes1 in groups treated with ES and iPS cells. *p<0.05 vs. DOX-MI and DOX-MI+CC; n = 5.