
Figure 4. Effects of transplanted ES and iPS cells on Akt and PTEN expression in DIC post MI.
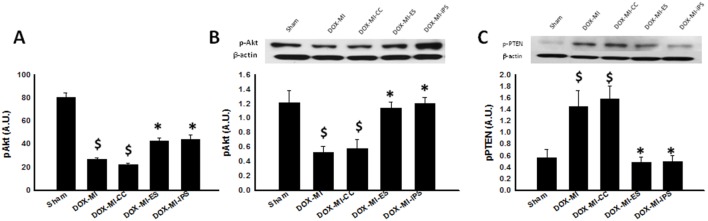
Left histogram (A), reveals a significant increase in pAkt activity in hearts transplanted with ES and iPS cells. $p<0.001 vs. Sham; *p<0.05 vs. DOX-MI and DOX-MI+CC; n = 4–5. (B) Top middle panel displays representative photomicrographs of WB bands for pAkt and β-actin and bottom middle histogram shows densitometric analysis of WB bands with a significant increase in levels of pAkt levels in ES and iPS cell treated hearts. $p<0.05 vs. Sham; *p<0.05 vs. DOX-MI and DOX-MI+CC; n = 4–5. Upper right panel (C) shows representative WB bands of PTEN and β-actin and bottom right histogram shows densitometry analysis of WB bands with a significant decrease in levels of PTEN in hearts transplanted with ES and iPS cells. $p<0.05 vs. Sham; *p<0.05 vs. DOX-MI and DOX-MI+CC; n = 4–6.