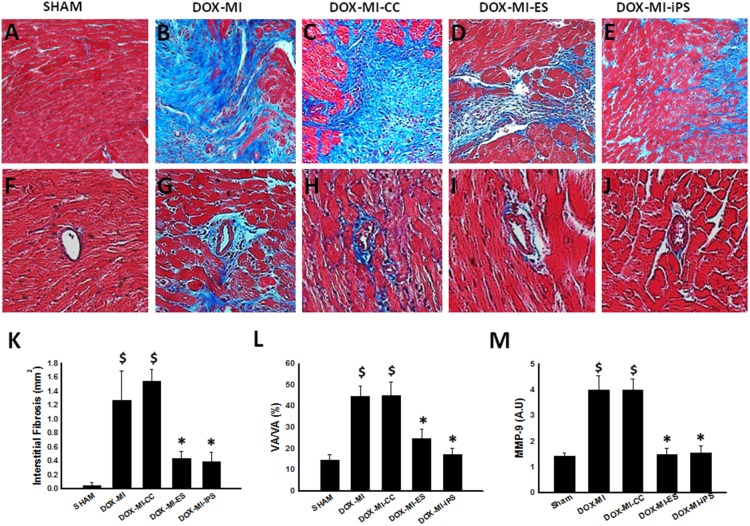
Figure 5. Effects of transplanted ES and iPS cells on cardiac fibrosis.
Representative photomicrographs of interstitial fibrosis (A–E), with fibrotic tissue in blue and healthy cardiac tissue in pink and vascular fibrosis (F–J). Bottom left histogram (K) shows a significant decrease in interstitial fibrosis (mm2) at 2 weeks post-MI in ES and iPS cell treated groups. $p<0.05 vs. Sham; *p<0.05 vs. DOX-MI and DOX-MI+CC; n = 5–7. Bottom middle histogram (L) shows quantitative analysis of vascular fibrosis over total vascular area with a significant decrease in vascular fibrosis percentage in DOX-MI+ES and DOX-MI+iPS groups when compared with DOX-MI and DOX-MI+CC. $p<0.05 vs. Sham; *p<0.05 vs. DOX-MI and DOX-MI+CC; n = 4–6. Bottom right histogram (M) shows quantitative analysis of MMP-9 expression for all treatment groups. $p<0.01 vs. Sham; *p<0.01 vs. DOX-MI and DOX-MI+CC; n = 4–6.

