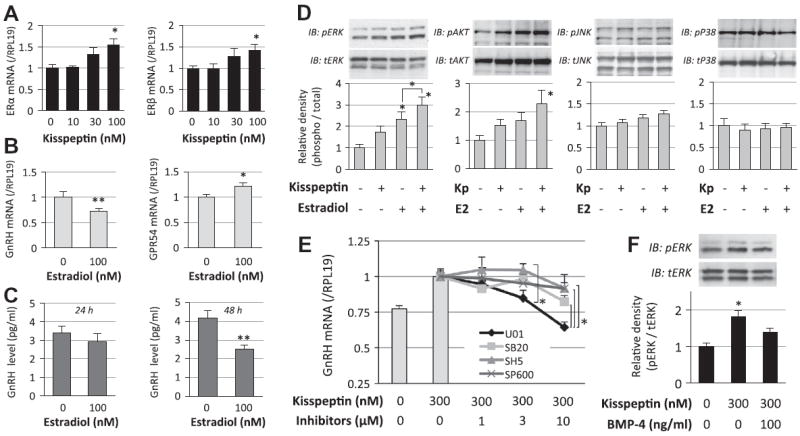
Fig. 4.

Interaction of kisspeptin and estrogen receptor signaling in GnRH induction by GT1-7 cells. (A and B) GT1-7 cells (2 × 10⁵ cells/ml) were treated with kisspeptin (10–100 nM) and estradiol (100 nM) in serum-free conditions for 24 h. Total cellular RNA was extracted and ERα, ERβ, GnRH and GPR54 mRNA levels were examined by realtime RT-PCR. The expression levels of target genes were standardized by RPL19 level in each sample. (C) Cells (2 × 10⁵ cells/ml) were treated with indicated concentrations of estradiol in serum-free conditions. After 24-h and 48-h culture, the culture media were collected and GnRH concentrations (pg/ml) were determined by a radioimmunoassay. (D and F) Cells (1 × 10⁵ cells/ml) were precultured in serum-free conditions in the absence or presence of estradiol (E2; 100 nM) and BMP-4 (100 ng/ml) for 24 h, and then stimulated with kisspeptin (Kp; 300 nM). After 15-min culture with kisspeptin treatment, cells were lysed and subjected to SDS–PAGE/immunoblotting (IB) analysis using anti-phospho-ERK1/2 (pERK) and anti-total-ERK1/2 (tERK), and anti-phospho-AKT (pAKT) and anti-total-AKT (tAKT), anti-phospho-JNK (pJNK) and anti-total JNK (tJNK), and anti-phospho-p38 (pP38) and anti-total-p38 (tP38) antibodies. The results shown are representative of those obtained from three independent experiments. The relative integrated density of each protein band was digitized, in which the phosphorylated levels were normalized by the total levels, and then the results were expressed as fold changes. (E) Cells (2 × 10⁵ cells/ml) were treated with MAPK and AKT inhibitors (1–10 μM), including U0126 (U01), SB203580 (SB20), SP600125 (SP600) and SH-5 (SH5), in combination with kisspeptin (300 nM) in serum-free conditions for 24 h. Total cellular RNA was extracted and GnRH mRNA levels were examined by real-time RT-PCR. Results in all panels are shown as means ± SEM of data from at least three separate experiments, each performed with triplicate samples. The results were analyzed by ANOVA (A, D–F) and unpaired t-test (B and C) and when a significant effect due to treatment was observed (P < 0.05), subsequent comparisons of group means were conducted. * P < 0.05 and ** P < 0.01 vs. control group and between the indicated groups.
