
Figure 2. a, b, c, d: Representative photomicrographs of H&E staining of the renal cortex at time zero (a) and Day 1 (b) and TUNEL staining at time zero (c) and Day 1 after infection (d) after infection.
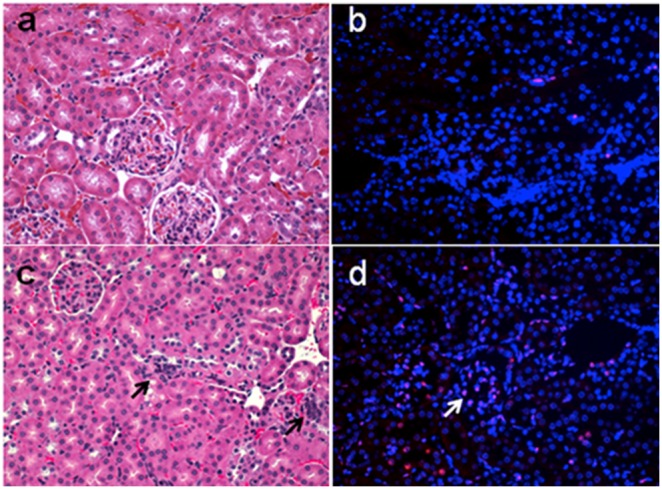
Arrows indicate areas of necrosis/apoptosis in the H&E stain and TUNEL labeled nuclei. Note inflammatory cell infiltration.