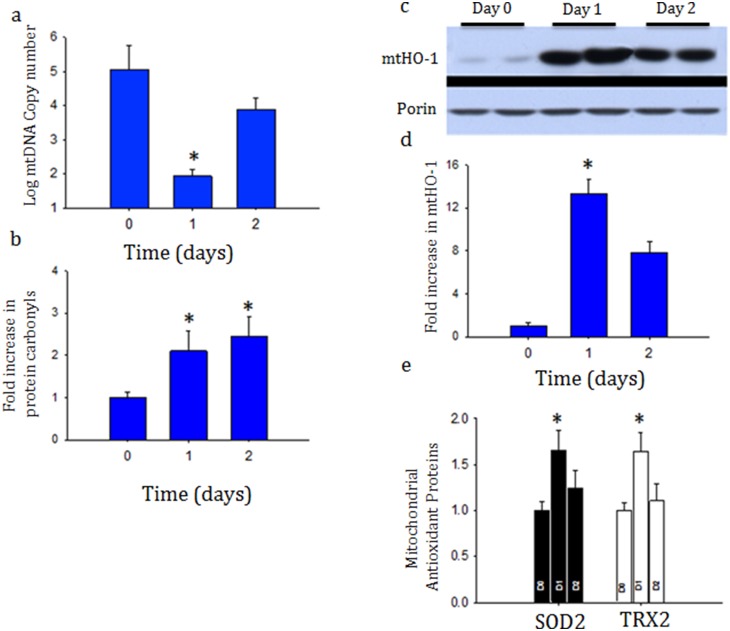
Figure 3. a, b, c, d and e: Mitochondrial DNA copy number based on real-time PCR of cytochrome B/18S levels from kidney (3a) after S. aureus infection.
MtDNA decreased only transiently suggesting active repair and biogenesis. Oxy-blot analysis of whole-cell protein carbonyl content of whole kidney after S. aureus sepsis (3b). Western blot analysis and densitometry of heme-oxygenase 1 (HO-1) levels in the mitochondrial fraction (3c and 3d). Mitochondrial antioxidant enzymes levels of superoxide dismutase (SOD2) and thioredoxin (TRX2) relative to porin densitometry analysis (3e). Data represents 6 mice in each group. *P<0.05 is considered significant by ANOVA and Tukey’s post-test analysis.

