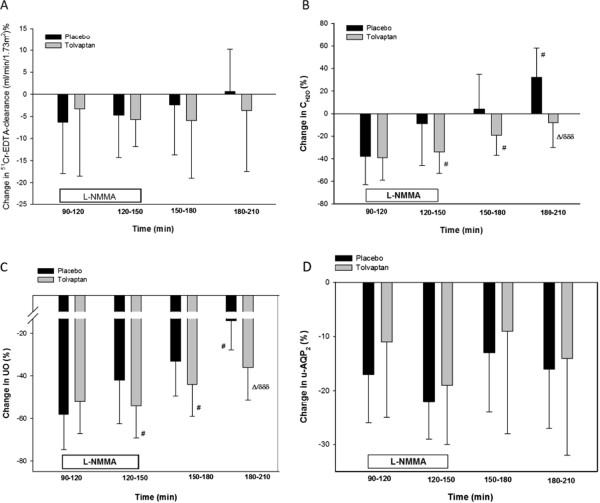
Figure 1.

Relative changes in GFR (A), CH2O(B), UO (C) and u-AQP2(D) during NO-inhibition. Values are mean ± SEM. General linear model (GLM) with repeated measurements was performed for comparison within the group (δ) and interventions as between (∆) subject factor. Paired t-test or Wilcoxon signed rank test (#) was performed for comparison within treatment group at baseline vs during infusion period 90–150 min, and baseline vs post infusion 150–210 min. #/∆ p < 0.05; δδδ p < 0.0001.
