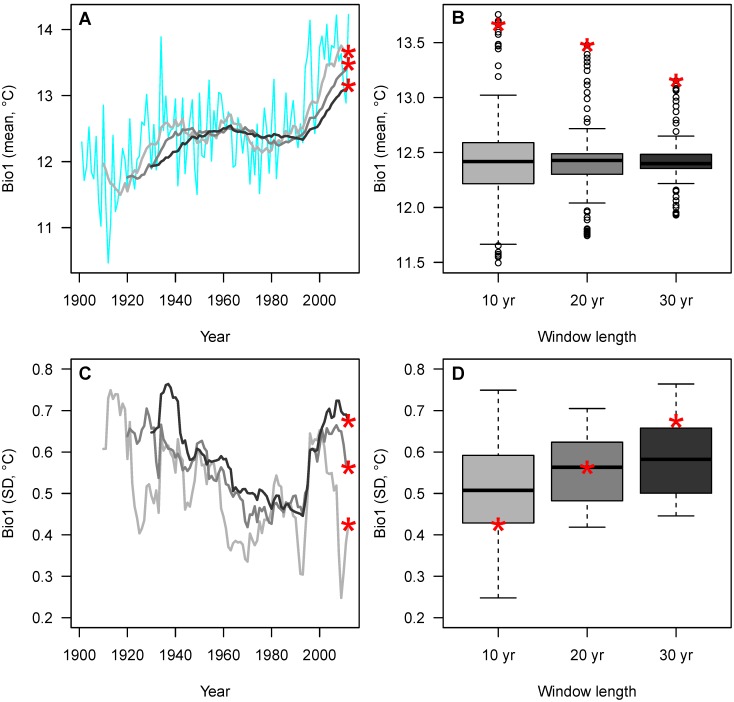
Figure 1. Example moving window time series (used to estimate HRV) and recent percentiles shown for Bio1 (annual mean temperature), Grand Canyon National Park (with 30 km buffer).
A, B) Moving window means; C, D) Moving window standard deviations (SD). Three moving windows –10 years (light gray), 20 years (medium gray), and 30 years (dark gray) – are calculated from the annual time series (blue, A). Bio1 values for the most recent windows (2003–2012 (10 yr), 1993–2012 (20 yr), 1983–2012 (30 yr)) are indicated by the red asterisks. Boxes in B and D are the inter-quartile range (median = thick perpendicular line), dashed lines the outer tails (1.5× inter-quartile range), and dots the outliers. Recent percentiles are calculated for the red asterisks shown in B and D.

