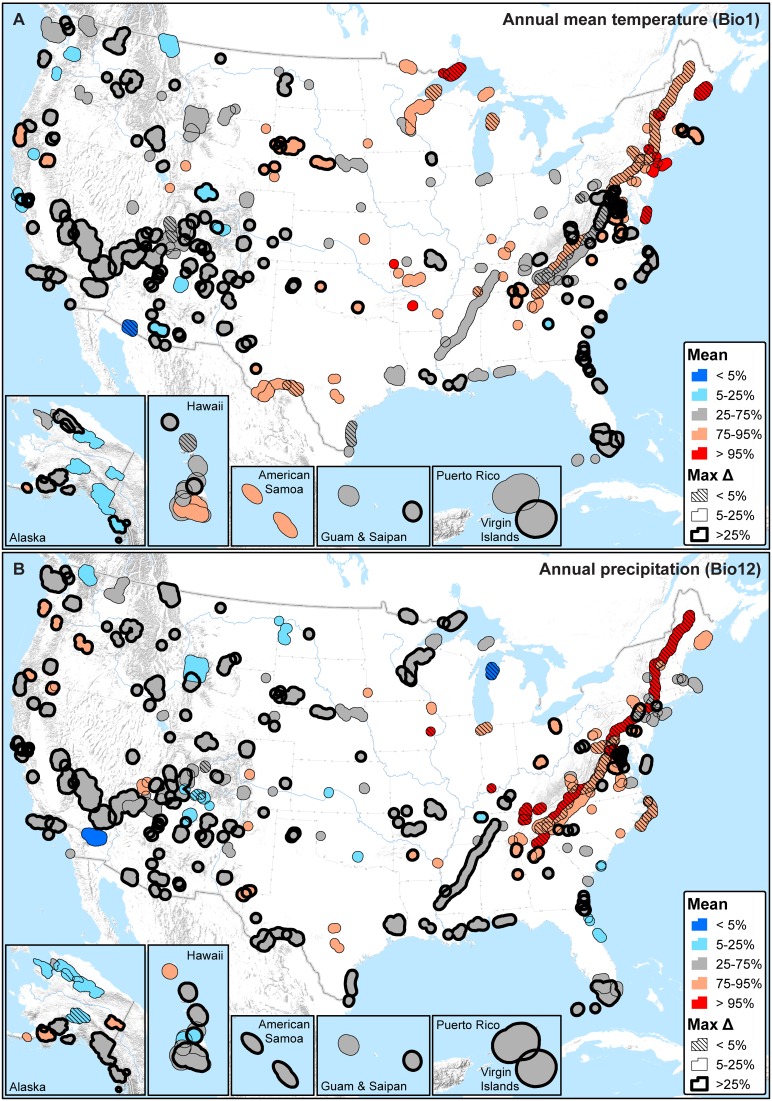
Figure 4. The average (Mean) and maximum difference (MaxΔ) of recent percentiles calculated for moving window standard deviations.
A) Annual mean temperature (Bio1); B) Annual precipitation (Bio12). Mean values provide an overall measure of recent (past 10, 20, and 30 year windows) climate change exposure with respect to 1901–2012 HRV, while the maximum difference measures sensitivity to moving window size (smaller values are less sensitive).

