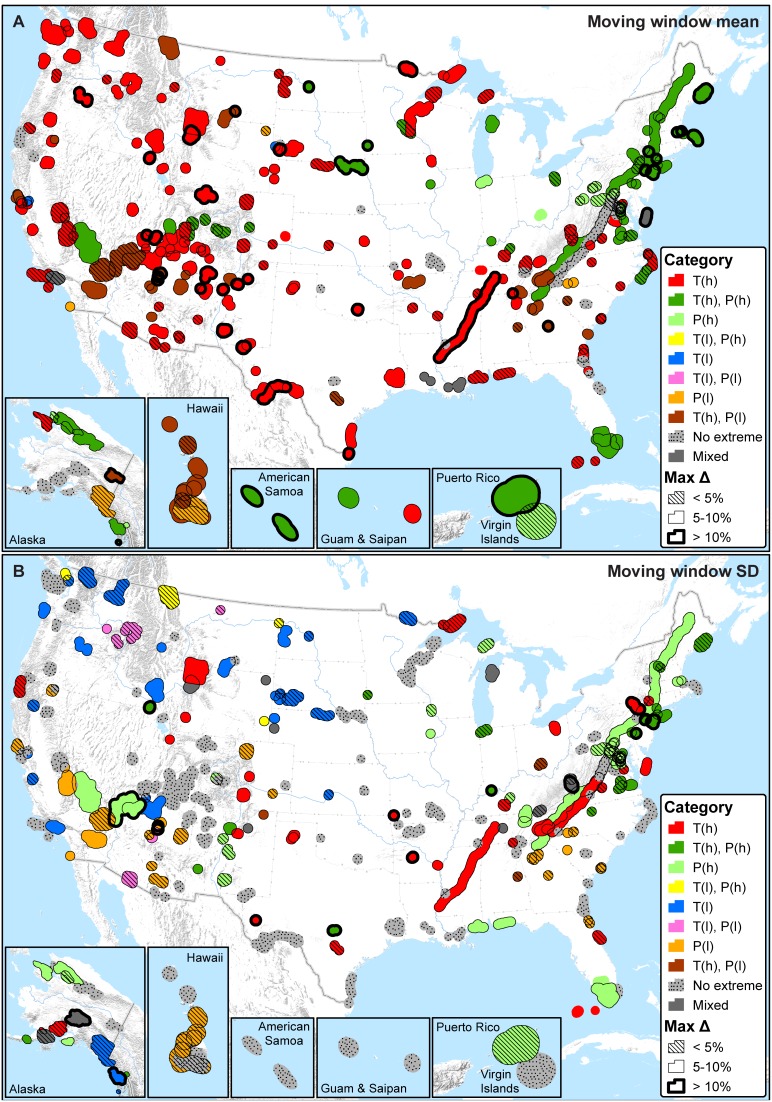
Figure 5. Summary of all temperature (Bio1, 5, 6, 8–11) and precipitation (Bio12–14, 16–19) variables with recent mean percentiles that are either less than the 5th percentile or greater than the 95th percentile (i.e., extreme on HRV).
A) Moving window means; B) Moving window standard deviations (SD). T(l) = one or more temperature variables low (<5th percentile; ‘cold’ or decreased inter-annual variability). T(h) = one or more temperature variables high (>95th percentile; ‘warm’ or increased inter-annual variability). P(l) = one or more precipitation variables low (<5th percentile; ‘dry’ or decreased inter-annual variability). P(h) = one or more precipitation variables high (>95th percentile; ‘wet’ or increased inter-annual variability). Parks with both T(l) and T(h) or both P(l) and P(h) are symbolized as ‘mixed’. Parks that fall between the 5th and 95th percentiles on all temperature and precipitation variables are symbolized as ‘no extreme’. The maximum difference (Max Δ) in percentile was calculated only for temperature and precipitation variables that were extreme; maximum values are reported to represent maximum sensitivity. Max Δ is undefined in the case of parks symbolized as ‘no extreme’; parks that fall into all other categories, and with a max Δ of 0, are also shown without outlines.

