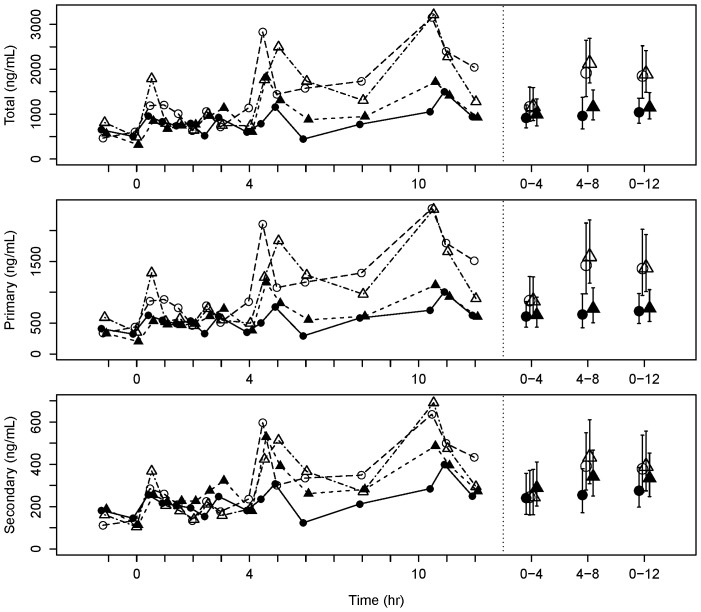
Figure 4. Postprandial serum bile acid profiles.
Mean serum total, primary and secondary bile acid concentration profiles over 12(left) and weighted mean AUC (± 95% confidence interval) over 0–4, 4–8 and 0–12 h (right). Data point shape and color represent different visits as described in Figure 2.

