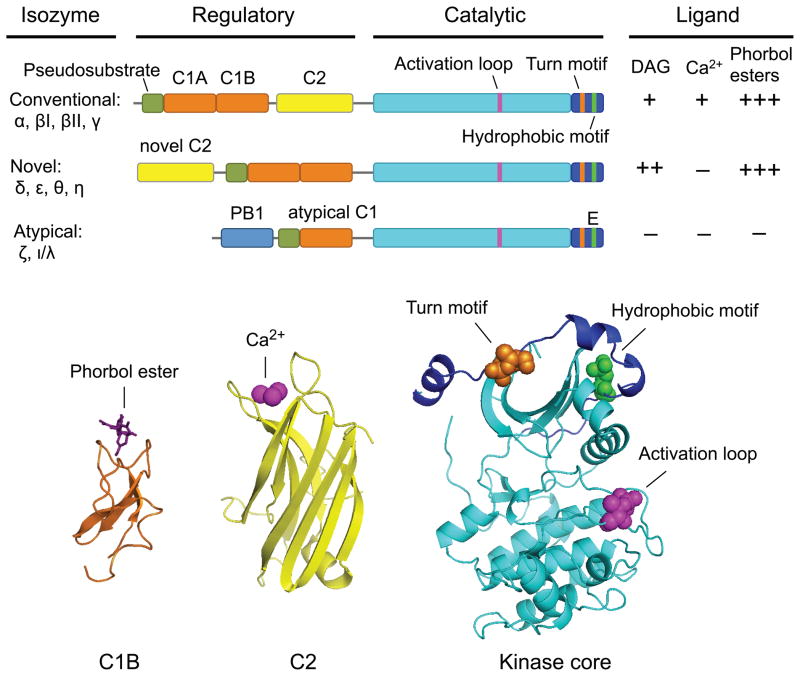
Figure 1. Structure and relative ligand-responsiveness of PKC isozymes.
Domain structure of PKC family members, showing autoinhibitory pseudosubstrate segment (green), C1 domains (orange), C2 domain (yellow), kinase core (cyan), and C-terminal tail (dark blue); the activation loop (pink), turn motif (orange), and hydrophobic motif (yellow) phosphorylation sites are indicated. The ligands that bind to each subfamily, along with their relative affinities, are indicated. Also shown are the crystal structures of the C1B [50], C2 [171], and kinase domains [80].

