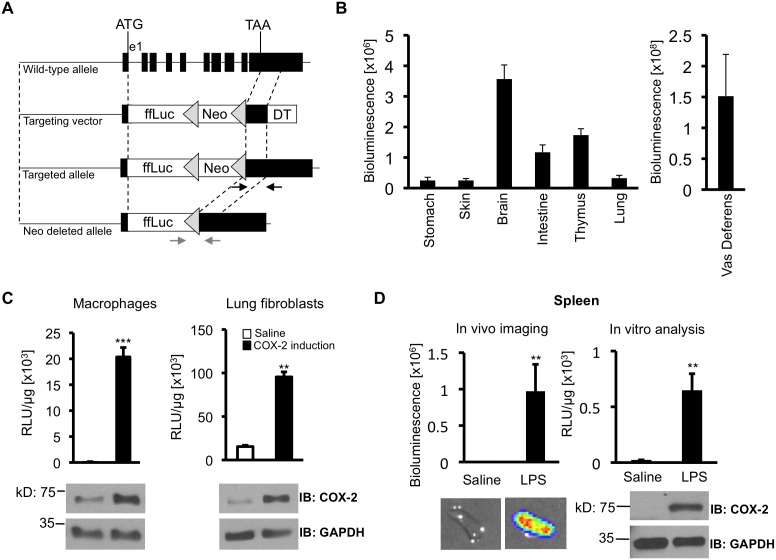
Figure 2. Construction of Cox2tm2Luc/+ a mouse strain in which firefly luciferase replaces the Cox2 coding region.
(A) Schematic representation of the wild-type Cox2 allele and the targeting strategy to create the Cox2tm2Luc knockin allele. The firefly luciferase coding region (ffLuc), PGK-neo (neo) selection cassette, and PGK-DT (DT) selection cassette in the targeting vector are shown as open boxes. Grey triangles depict loxP sites. Homologous recombination was confirmed by PCR (black arrows) and Southern blot analysis in ES cells. The neomycin-resistance cassette was deleted by Cre recombinase expression, resulting in the ‘neo-deleted’ allele. Deletion was confirmed by PCR (grey arrows). Cox2 gene sequences are replaced by the firefly luciferase coding region between the ATG translational start site located at the end of exon 1 (e1) and the TAA Cox2 stop codon located on exon 10. There are no modifications of the untranslated 5′UTR and 3′UTR either upstream of the ATG or downstream from the TAA. (B) Unstimulated luciferase activity in isolated Cox2tm2Luc/+ tissues. Luciferase activity was quantified by ex vivo bioluminescent imaging. Data are means +/− SD (n = 4). (C) COX-2 and luciferase induction in primary cells isolated from Cox2tm2Luc/+ mice. Bone marrow macrophage cultures were stimulated with LPS (50 ng/mL) for four hours. Lung fibroblast cultures were stimulated with 20% serum for six hours. Cell extracts were analyzed for luciferase enzymatic activity and COX-2 protein. Luciferase activity is displayed as relative light units (RLU) per microgram protein. Data are means +/− SD (**, p<0.01, ***, p<0.001, n = 3). (D) Interferon gamma and endotoxin (IFNγ/LPS) COX-2 and luciferase induction in the spleens of heterozygous Cox2tm2Luc/+ mice. Four mice were injected i.p. with IFNγ, (1 µg/mouse) and two hours later with LPS (3 mg/kg) or saline. After 6 hours, mice were euthanized, spleens were excised and luciferase bioluminescence was quantified by bioluminescent imaging (left panel). Luciferase enzymatic activity and COX-2 protein levels were measured in extracts (right panel). Data are means +/− SD (**, p<0.01).

