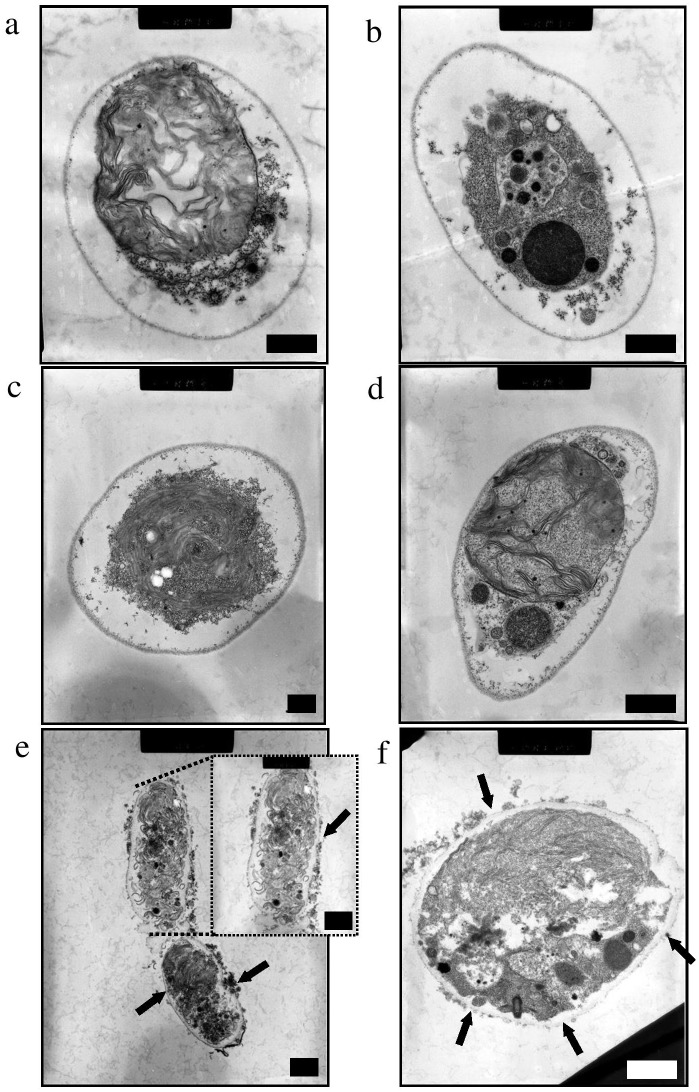
Figure 1. Cross-sectioned transmission electron microscopy (TEM) images.
(a, b) intact cells, (c) cells after pre-treated vortexing or (d) ultrasonication with aminoclay-DNA hybrid for 60 s, and (e, f) cells pre-treated with aminoclay-DNA hybrid after spreading with a stir bar on an agar plate (4.0%). The inset in the image (e) shows a cell at high magnification. Black arrows (in e and f) indicate damaged or fractured cell walls. All scale bars = 1 µm.

