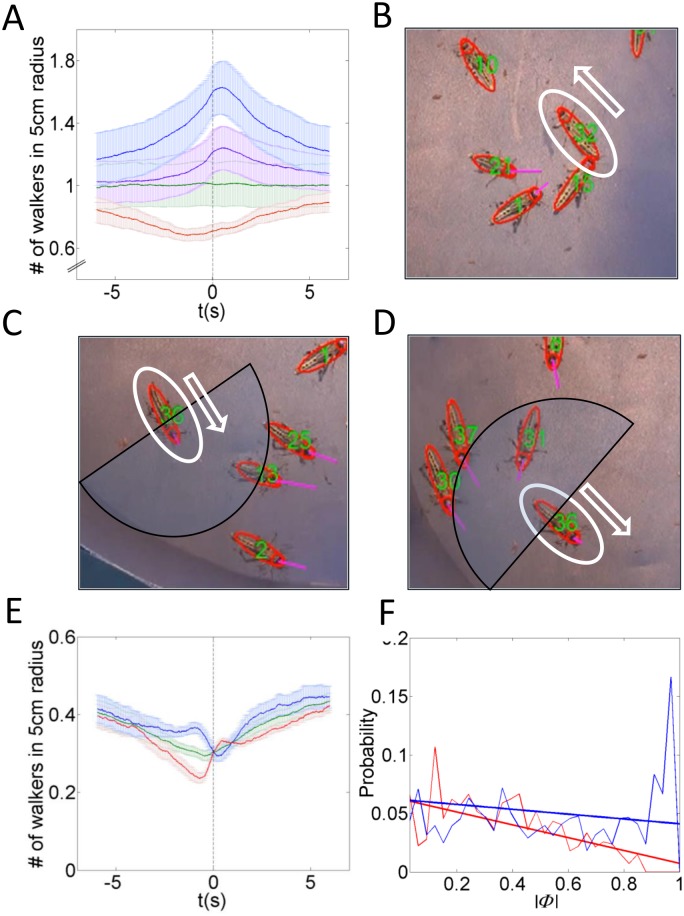
Figure 2. Experimental results.
(A) The average number of animals walking within 5cm of to an individual that is starting to walk. The vertical line shows the time of walking initiation. Green line: random frames and animals. Purple line: all walking initiation events. Blue line: tactile stimuli-related events. Red line: non-tactile events. (B–D) Zoom-in showing the interaction between conspecifics. (B) Tactile interaction (C) Visual stimulus from the front and (D) Visual stimulus from the rear. (E) The average number of walking animals before and after walking initiation (time = 0). Colors indicate front (red), back (blue) and both (green). (F) The probability of changing orientation (U-turn) when resuming movement is a function of the order parameter. As  increases, the probability of turning in the direction the crowd moves (blue) becomes larger than the probability of turning against it (red). As expected, fluctuation at small
  are large since the system spends a relatively short amount of time in this state. The line shows a linear least squares fit as a guide to the eye.

