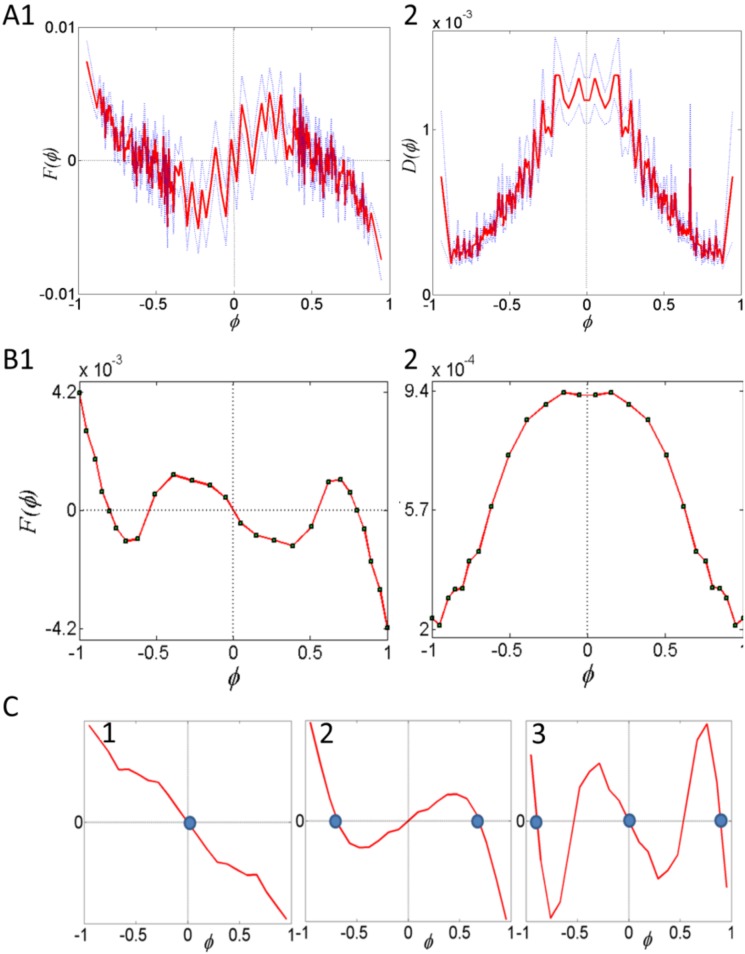
Figure 4. Effective dynamics of the order parameter in experiments.
(A) Experiments. 1. The effective drift. The zeros of  , corresponding to fixed points, cannot be observed due to a large statistical error. 2. The effective diffusion shows a clear peak at small values of
  . Compare with Yates et al. [21]. The blue dotted line indicates the statistical error. (B) Detailed model. 1. The effective drift shows three meta-stable states. 2. The effective diffusion. (C) Simplified model – the predicted behavior of large swarms. The figure shows the effective drift function as obtained in a simplified model with several hundred particles. By changing the probability of turning, the admissible meta-stable states of the system are either 1. Only disordered, 2. Only ordered 3. Both ordered and disordered. Hence, social interactions determine the macroscopic dynamics of the system. Statistical errors in (B) and (C) are of the order of the size of the symbols.

