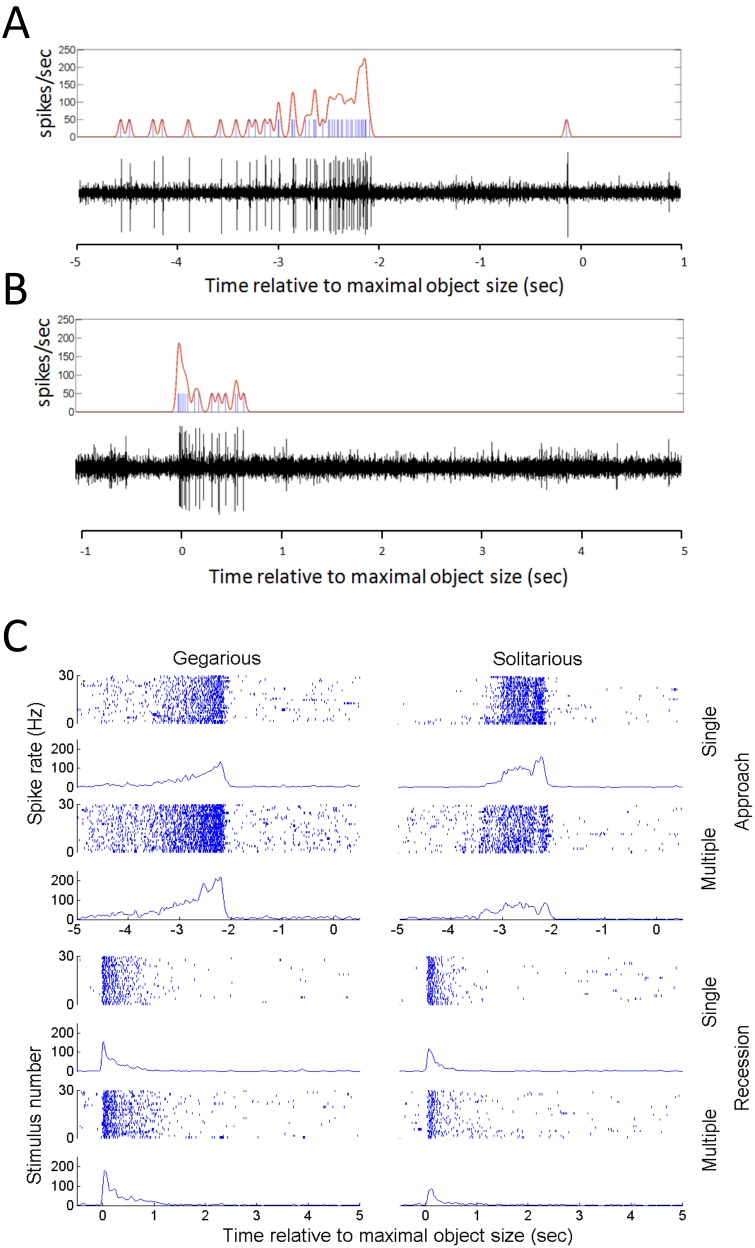
Figure 6. Typical response of the DCMD to approaching (A) and receding (B) stimuli.
DCMD spike occurrence times (blue) were extracted from the extracellular recordings (black). Individual raster trials were then smoothed with a 20 ms Gaussian window and an evaluation of the instantaneous firing rate (red) was calculated by normalizing the resulting waveform so that its integral equals the number of spikes in the trial. (C) Firing patterns of DCMD in a solitarious and a gregarious animal, in response to the four types of visual stimuli. Each raster plot includes the response of DCMD to 30 sequential stimulations of the same kind, with the first at the bottom of the stack. Mean instantaneous firing rate across trials is shown in the histogram below each raster plot. While the response of DCMD to a single approach and recession bear similarity between the two phases, gregarious nymphs show higher numbers of spikes in response to multiple approach and recession than solitarious animals.

