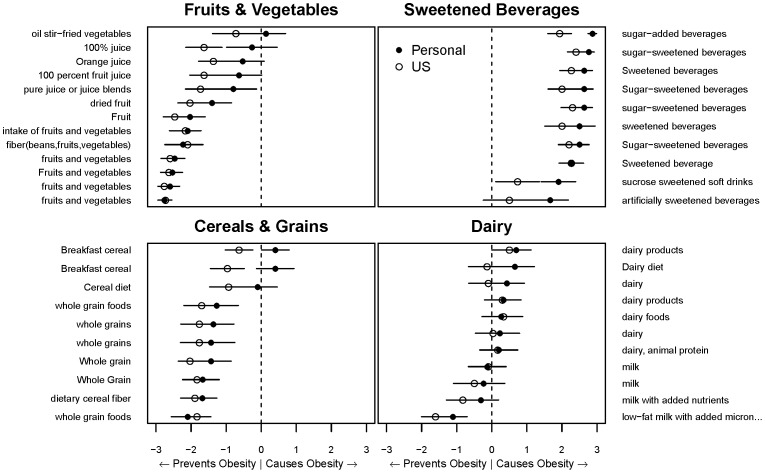
Figure 3. Example of groups of foods and average obesogenicity ratings.
Each food listed on the y-axes is shown as synthesized by microworkers in Fig. 1 Step B.9. Foods are ordered within each panel top to bottom with the personal opinion from most to least obesogenic. The vertical dotted line represents the transition from popular opinion indicating the food prevents obesity (left) to causes obesity (right). Each point represents the mean ±95% CI. Note that these results are only meant to reflect an estimate of popular opinion, and do not necessarily reflect the actual obesogenicity of any given food.

