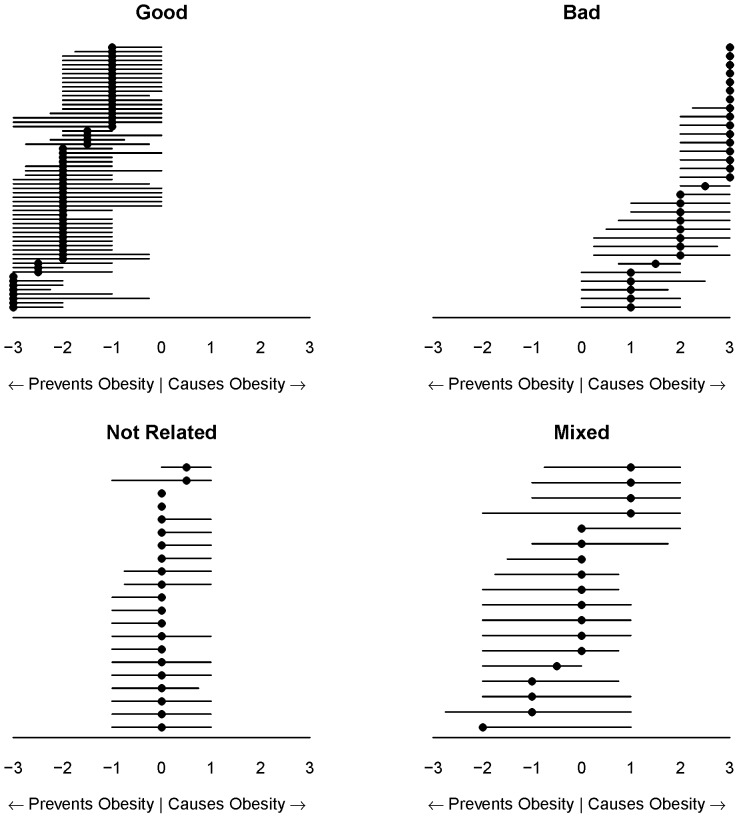
Figure 5. Quartile-based categorization of perceived obesogenicity foods.
Foods were categorized dependent on the median and quartiles as follows: Good (“Prevents Obesity”), median ≤−1 and Q3≤0; Bad (“Causes Obesity”), median ≥1 and Q1≥0; Not Related, median and IQR between −1 and 1; Mixed (depends on who eats the food), median and IQR spanning other categories. Each dot represents the median spanned by Q1 to Q3 for each included food.

