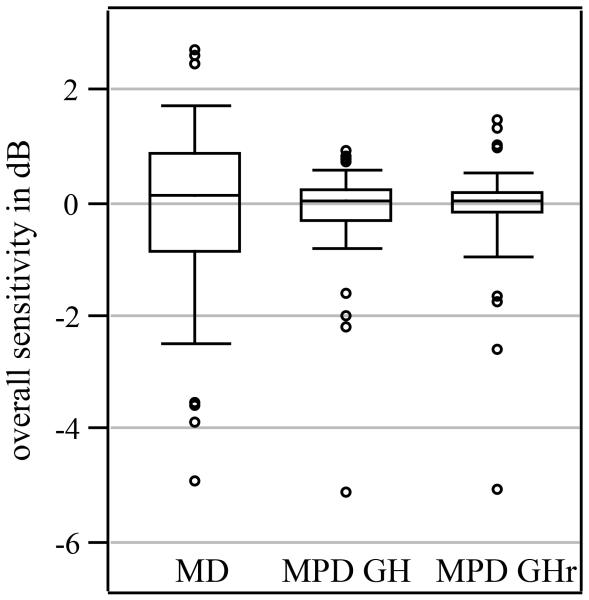
Figure 1. Distribution of MD, MPD from GH, and MPD from GHr for control subjects.
The figure shows boxplots for mean deviation (MD), for mean pattern deviation from general height (MPD from GH) and for mean pattern deviation from general sensitivity (MPD from GHr). The bottom and top of the boxes are the first and third quantile and the bottom and top whiskers are the percentiles 5 and 95, respectively. The open circles are individual values below percentile 1 and above percentile 99.

