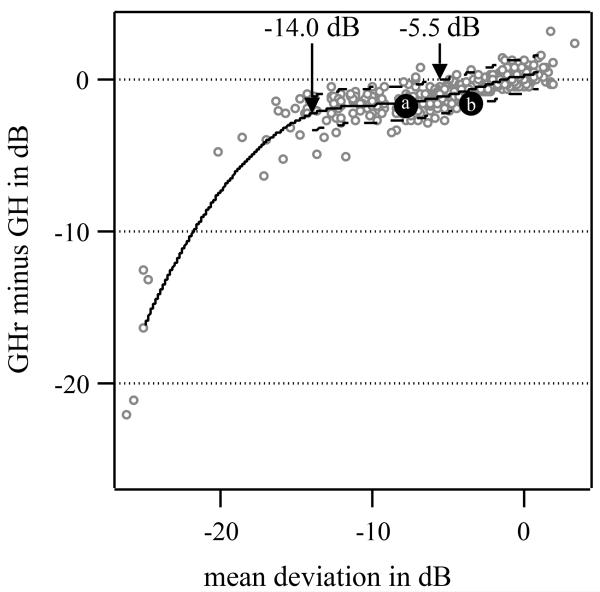
Figure 2. Differences in GH estimates and GHr estimates as a function of mean deviation for patients with glaucoma.
The open circles are individual differences and the solid curve is a loess fit [28] to show central trends in the scatterplot. The loess curve was obtained with the R loess function with parameter values for span and degree equal to 0.4 and 2, respectively. The dashed curves show the loess fit ± 1.96 standard deviation of estimate differences for MD above −14.0 dB, the point from which agreement between GH and GHr is no longer approximately linear. The solid gray circles labeled (a) and (b) are two of the three selected examples commented on in the Discussion section and Figure 4.

