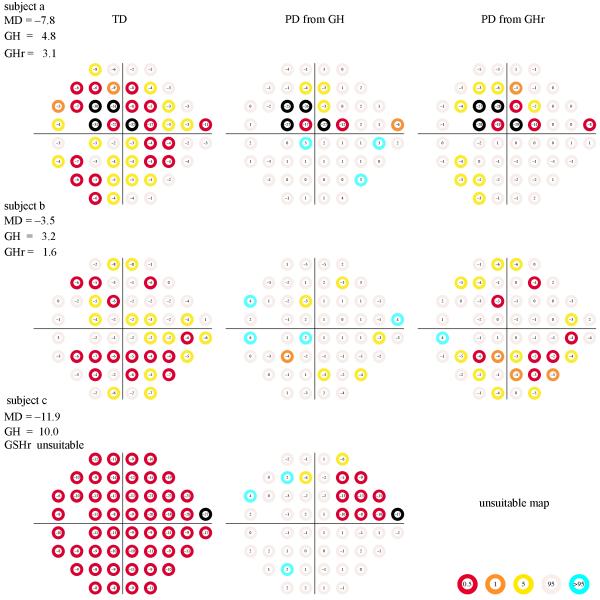
Figure 4. Three visual field examples.
The TD maps (left column), PD from GH (center column), and PD from GHr (right column) for three patients with glaucoma. Patients (a) and (b) are marked in Figure 2. Patient (c) was not present in Figure 2 because the GHr estimate was regarded as unreliable. The PD from GH estimates are slightly different from those observed from the Humphrey Field Analyzer mainly because there is an offset of 1.8 dB (see Methods: The GH and GHr estimators), but also because we used the visualFields package for the generation of the maps, which have different normative values than the Humphrey Field Analyzer. The color code at each percentile category in the TD probability maps and the empirical TD-rank curves are shown in the bottom middle.

