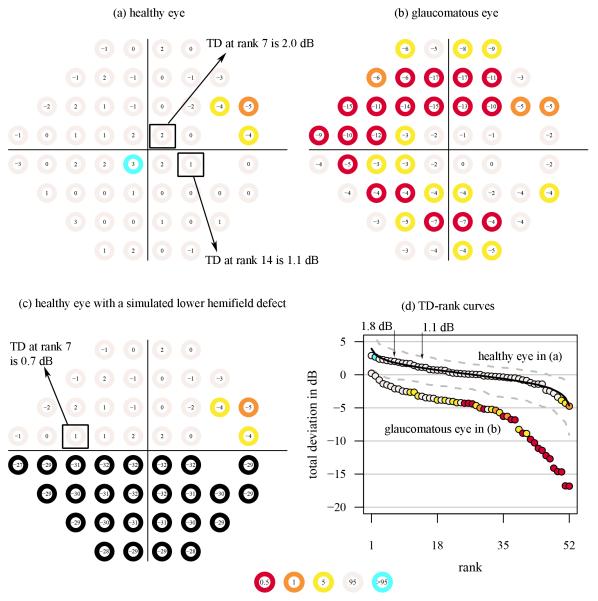
Figure A1. TD maps and TD-rank curves.
Three TD maps (consisting of TD values on top of circles with corresponding color-coded probability categories for (a) a healthy eye and (b) a glaucomatous eye obtained using the 24–2 visual field test grid and SITA standard. The visual field in (c) is the same as for the healthy eye in (a) after artificially adding a lower-field defect (sensitivities equal to zero at all locations). In (d), the TD-rank curves are shown for the visual fields in (a) and (b), but not (c) for clarity. The solid curve shows the mean normal TD-rank curve. The vertical arrows denote the TD at rank positions 7 and 14. The dashed curves in c and d are the 95% confidence limits for the normal TD-rank curve. The color code at each percentile category in the TD probability maps and the empirical TD-rank curves are shown in the bottom middle.

