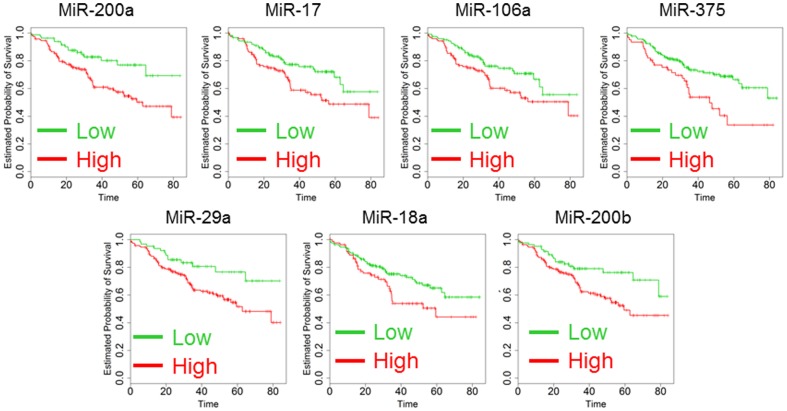
Figure 2. Kaplan-Maier analysis of 267 patients according to the analysis of Mir-200a, Mir-17, Mir-106a, MiR-375, Mir-29a, MiR-18a and Mir-200b expression.
Kaplan-Maier analysis was performed dividing the patients as high (green) and low (red) setting. Survival time scale is in months. All the differences were significant and p-values are reported in Table 2 (Log-rank test).

