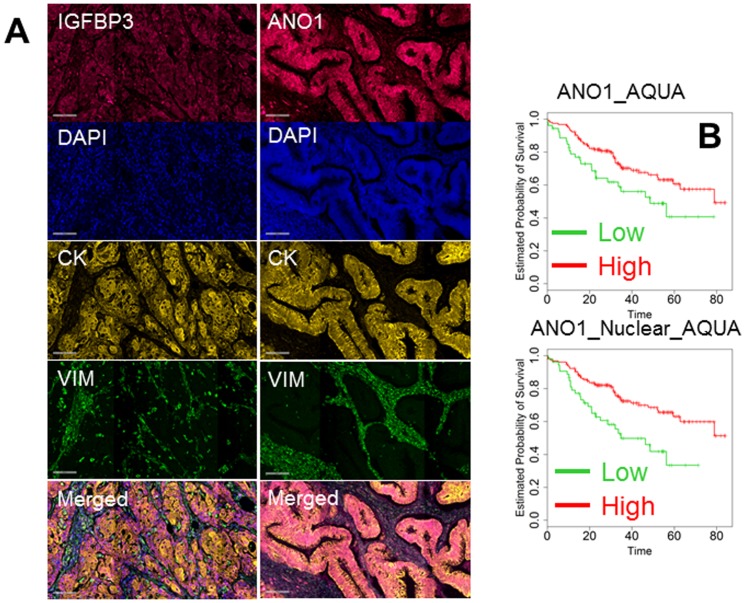
Figure 4. Representative quantitative immunofluorescence for IGFBP3 (left column) and ANO1 (right column).
A: From top to bottom the following signals are represented: antigen of interest (red channel), cell nuclei (DAPI), tumor cells (cytokeratin), stromal cells (vimentin) and merged image. B: Kaplan-Maier analysis of 267 patients according to the expression of AQUA scores of ANO1 inside the tumor mask (ANO1_AQUA) and in the nucleus of cancer cells (ANO1_Nuclear_AQUA). Kaplan-Maier analysis was performed dividing the patients as high (green) and low (red) setting. All the differences were significant and p-values are reported in Table 5 (Log-rank test).

