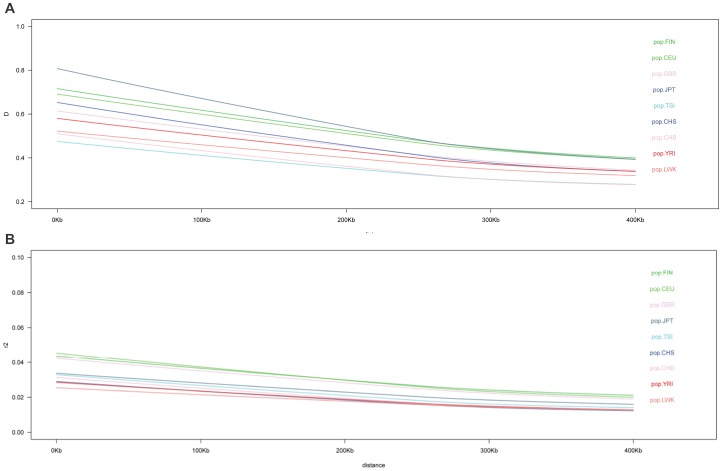
Figure 3. Across sample comparison linkage disequilibrium as a function of pairwise distance between SNPs for similar number of individual (n = 85) as measured by D′ (A) and R2 (B).
(A) Across sample comparison of Median of LD (D′) as a function of pairwise distance between SNPs for similar number of individual (n = 85). (B) Across sample comparison of Median of LD (R2′) as a function of pairwise distance between SNPs for similar number of individual (n = 85). We resampled 85 unrelated individuals from the various populations of the 1000 Genomes in order to compare the LD decay pattern for a similar sample size. The figure shows the relation between the median percentile of pairwise LD measures according to the distance between the two markers between 0 and 400 Kb.

