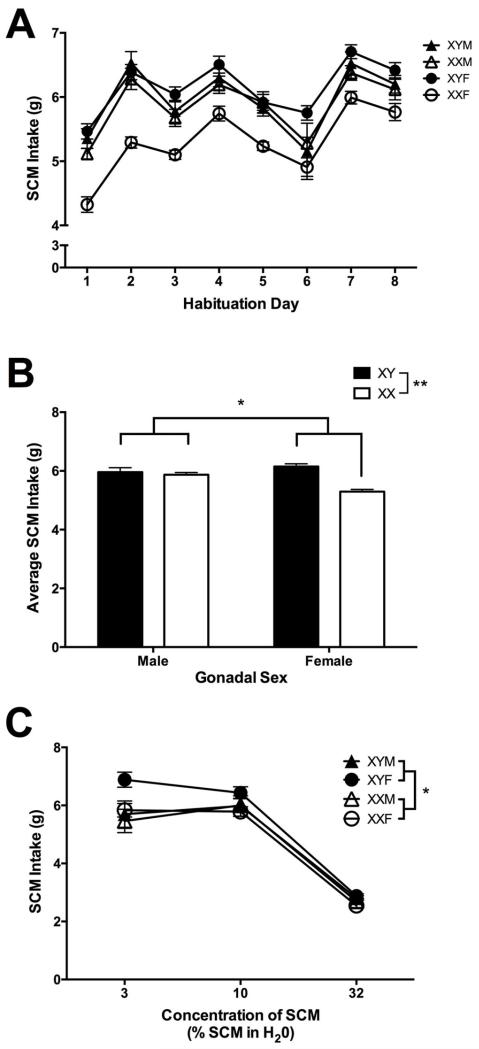
Figure 2.
Consumption of a 10% SCM solution (measured in grams) in the 2-bottle, free-consumption test across the eight assessment days (Panel A) and the average (mean +/− SEM) of those eight days (Panel B) plotted as a function of chromosome complement (XX – open symbols; XY – close symbols) and gonadal sex (male – triangles; female – circles). Average consumption (mean +/− SEM) of differing concentrations of SCM solution (measured in grams) plotted as a function of chromosome complement (XX – open symbols; XY – close symbols) and gonadal sex (male – triangles; female – circles) (Panel C). * p<0.05, ** p<0.01; SCM – sweetened condensed milk; M – male; F – female.

