
Figure 4. Mtbp overexpression promotes Myc oncogenic activity.
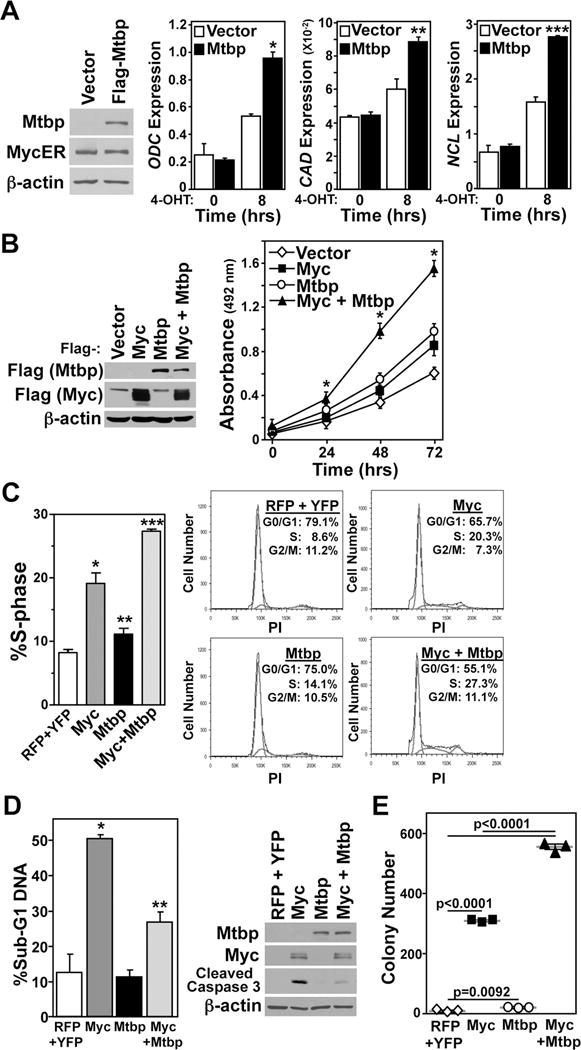
(A) MycER expressing NIH3T3 were transfected with an empty vector or a vector encoding Flag-Mtbp. Western blots of whole cell lysates were performed. Additionally, MycER was activated in the fibroblasts with 4-OHT for 0 or 8 hrs. qRT-PCR was performed, in triplicate, for the indicated Myc target genes. All samples were normalized to β-actin (*p=0.0032, **p=0.016, ***p=0.0004). (B) NIH3T3 cells were transfected with empty vector or vectors encoding the indicated proteins. Western blots of whole cell lysates were performed. MTS assays were performed at 24 hr intervals (*p<0.001 Myc vs. Myc + Mtbp). (C–E) NIH3T3 cells infected with two bicistronic retroviruses encoding the indicated proteins were analyzed. (C, D) Flow cytometry analysis after propidium iodide staining of DNA. The percentage of cells in each phase of the cell cycle was determined by Dean-Jett-Fox analysis (grey line; *p=0.012 RFP+YFP vs. Myc, **p=0.0296 RFP+YFP vs. Mtbp, ***p=0.0191 Myc + Mtbp vs. Myc); representative histograms shown (C). The proportion of cells with sub-G1 DNA content was measured following 1% serum culture conditions for 24 hours (D; *p=0.0025 RFP + YFP vs. Myc, **p=0.0018 Myc vs. Myc + Mtbp). Western blots were performed (D). (E) Cells were subjected to soft agar colony assay, and colony number was quantified after 10 days. Error bars are standard deviation. P values determined by student’s t-tests.