
Figure 5. Increased Mtbp expression cooperates with Myc overexpression in vivo and correlates with poor breast cancer prognosis.
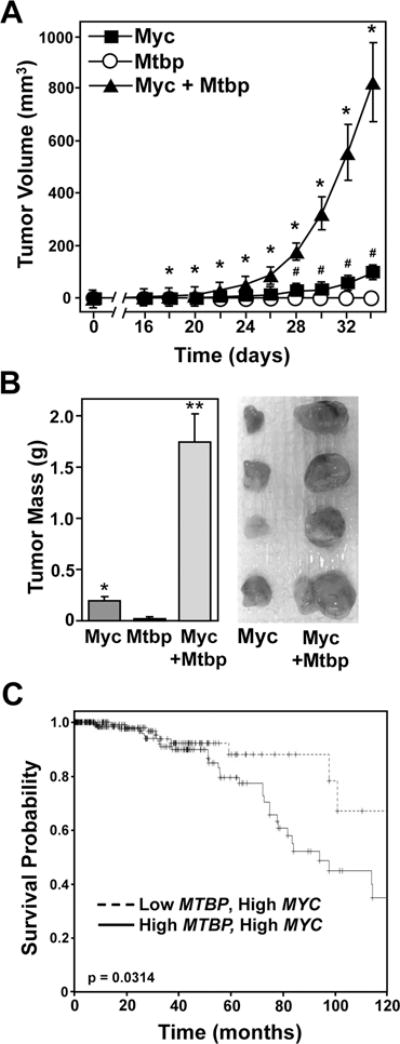
(A) Equal numbers of NIH3T3 cells expressing Mtbp, Myc, or both were injected subcutaneously into the flanks of nude mice (n = 16/group), and tumor volume was measured at intervals (#p<0.001 Myc vs. Mtbp, *p<0.0001 Myc vs. Myc + Mtbp). (B) After 34 days, tumors were extracted, weighed (*p=0.0073 Mtbp vs. Myc, **p<0.0001 Myc vs. Myc + Mtbp), and photographed. Photo of representative tumors shown. Error bars represent standard error of the mean; p values determined by student’s t-tests (A, B). (C) Kaplan Meier survival curves from RNA-Seq mRNA expression data from the TCGA database of breast cancers with high MYC mRNA expression divided into low (n = 171) or high (n = 250) MTBP mRNA expression. Log-rank test determined p-value.