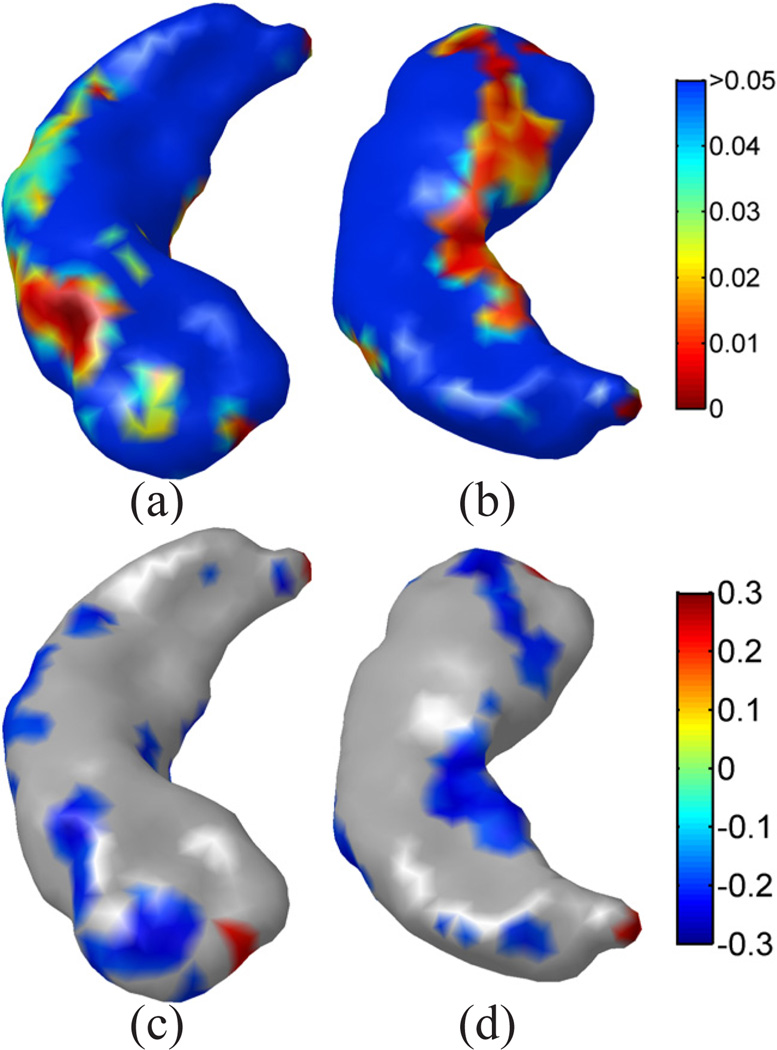
Figure 14.
Hippocampal mapping results from our method. (a)(b) Superior and inferior views of the p-value map. (c)(d) Superior and inferior views of the correlation coefficients with CES-D scores. Note that regions with non-significant correlation coefficients have been masked out and plotted as gray. 10,000 permutation tests were applied and an overall p-value of 0.016 was obtained.

