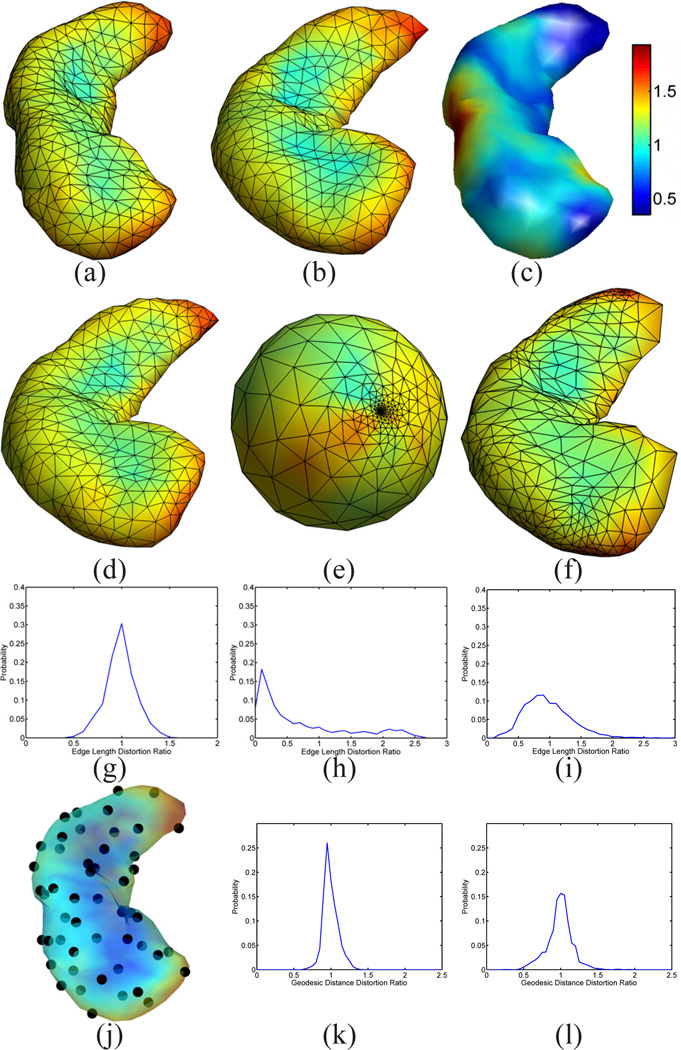
Figure 7.
Mapping results of hippocampal surfaces. (a) The source surface ℳ1. (b) The target surface ℳ2. (c) The optimized metric w. (d) The projection of the source mesh onto the target surface. (e) The projection of the source mesh onto the unit sphere with spherical conformal map. (f) The projection of the source mesh onto the target surface after Spherical Demons registration. (g) Metric distortion of our map: 0.99 ± 0.16 (Mean±STD, same for (h)(i)(k) and (l)). (h) Metric distortion of the spherical conformal map: 0.69 ± 0.71. (i) Metric distortion of the map after Spherical Demons registration: 0.97 ± 0.38. (j) Point set for the computation of geodesic distances. (k) Distortion ratio of Geodesic distances with our map: 0.99 ± 0.10. (l) Distortion ratio of geodesic distances with the map from Spherical Demons registration: 0.99 ± 0.17.

