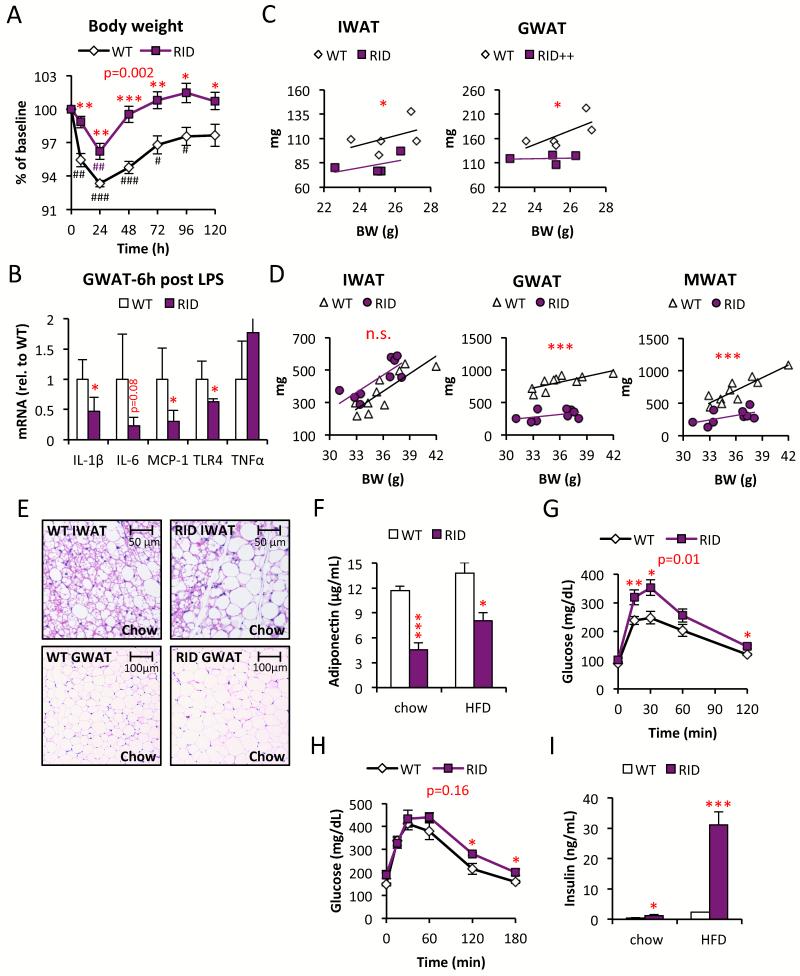
Figure 2. Reduced fat mass and reduced glucose tolerance in RID tg mice.
(A) LPS (0.3 mg/kg)-induced body weight change in male RID tg and wildtype controls. (B) Gene expression in GWAT harvested from male RID tg and wildtype controls 6h after LPS injection. (C) IWAT and GWAT in relation to body weight in chow-fed male RID tg and wildtype mice. (D) IWAT, GWAT and MWAT in relation to body weight in 15 week HFD-fed male RID tg and wildtype mice. (E) Representative H&E stain of IWAT and GWAT in male RID tg and wildtype mice on chow (F) Adiponectin levels in male RID tg and wildtype mice on chow and after 12 weeks HFD. Glucose tolerance in (G) chow-fed and (H) 12-week HFD-fed male RID tg and wildtype mice. (I) Serum-insulin levels in 3 h fasted male RID tg and wildtype mice. 1-way ANOVA analysis shows that both diet (F=8.1, p=0.013) and genotype (F=12.3, p=0.004) contribute significantly to collagen levels. Error bars represent SEM, a p-value <0.05 according to student t-test was considered as significant and is indicated by */#; **/##: p<0.01; ***/###: p<0.001 (* = Difference in between genotype, # = Difference from initial weight). P-values in red indicate difference between groups during time courses according to repeated measurement ANOVA.

