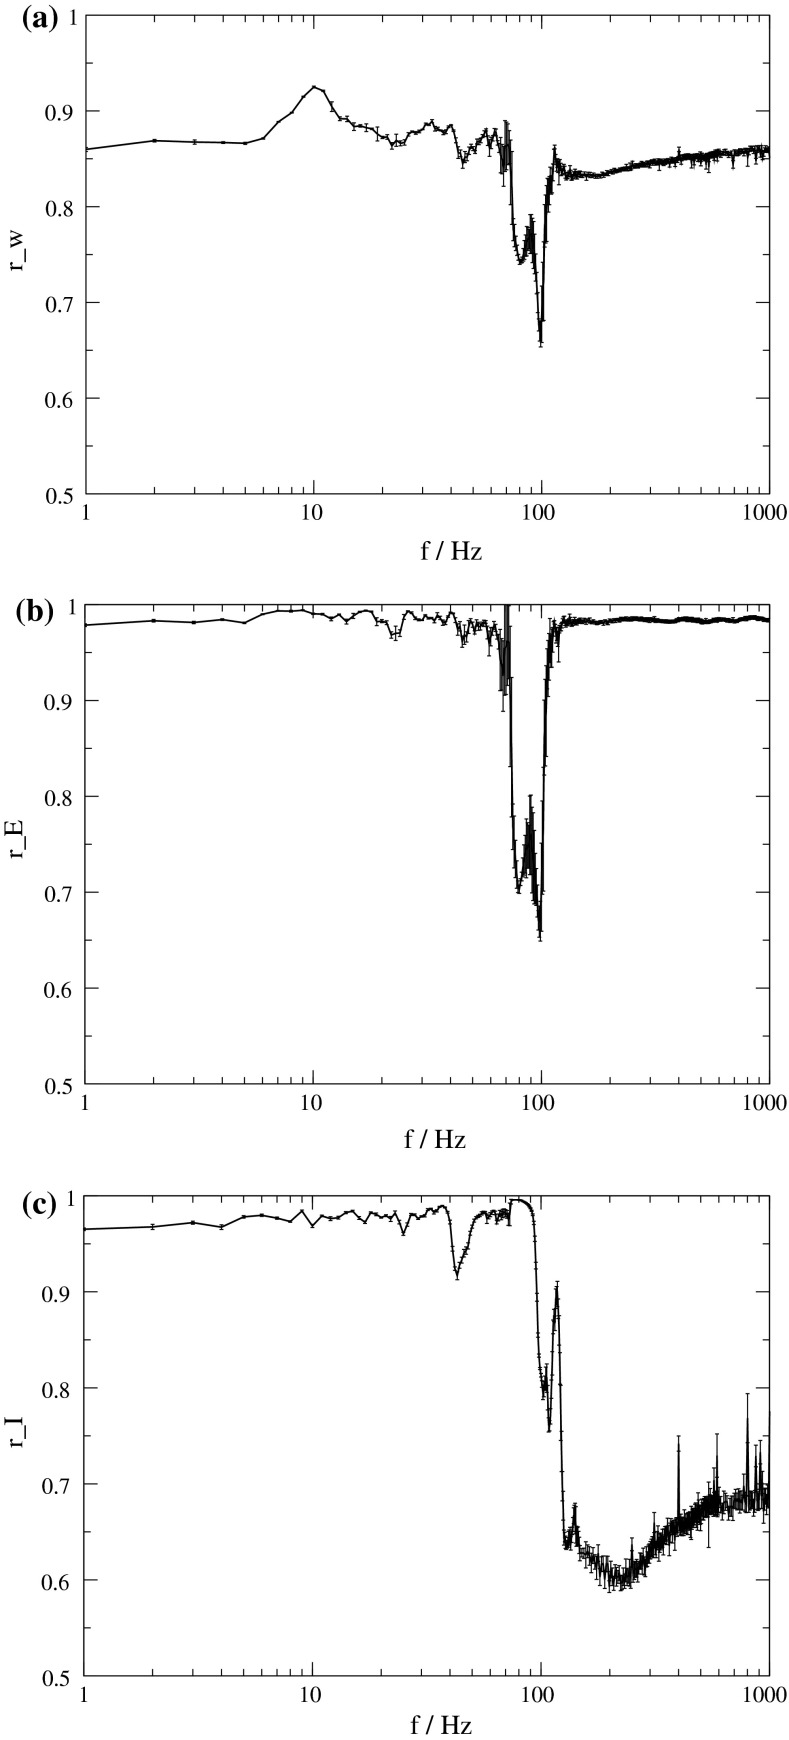
Fig. 3.
Dependence of the order parameter on the frequency of stimulation. Intensity of stimulation is 10. a r W of the whole population. b r E of the excitatory subpopulation. c r I of the inhibitory subpopulation. In all three plots, averages are shown over 15 simulations, and the corresponding standard deviations are indicated by error bars

