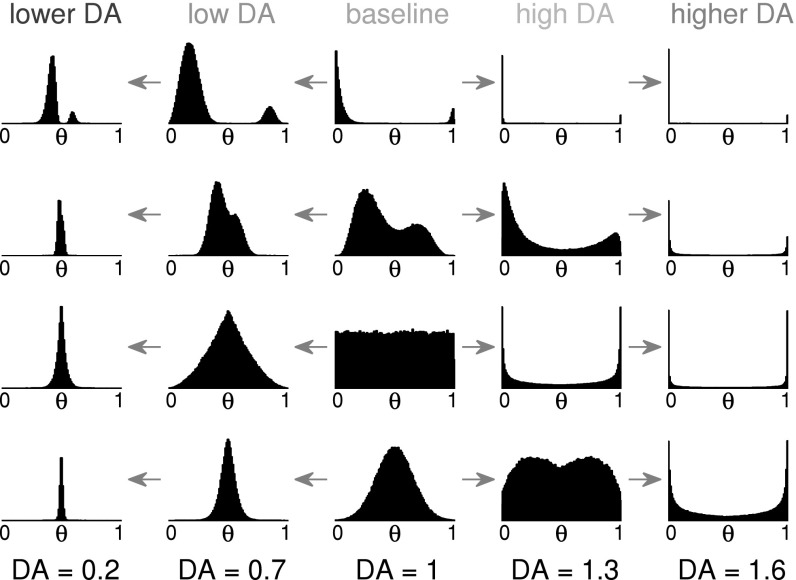
Fig. 2.
Effects of the proposed effective weight rule on existing weight distributions. Example weight distributions at DA = 1 are given in the centre column. On the right are the effective weight distributions for high DA, and on the left are the effective weight distributions at low DA levels as defined in Eqs. 1 and 2. Rows 1 and 2 Any double-peak distribution where the two peaks are on opposite sides of θ will remain so for high DA, but with increased sparseness. For low DA levels, the two peaks move closer to θ, and thereby make discrimination of strong versus weak weights increasingly difficult. Rows 3 and 4 A uniform or a normal distribution of weights around θ will act as a true bimodal distribution for high DA levels and become a thin unimodal distribution for low levels of DA. The reduced signal-to-noise ratio for low DA and increased ratio for high DA (assuming the signal is represented by the strong weights) becomes visible

