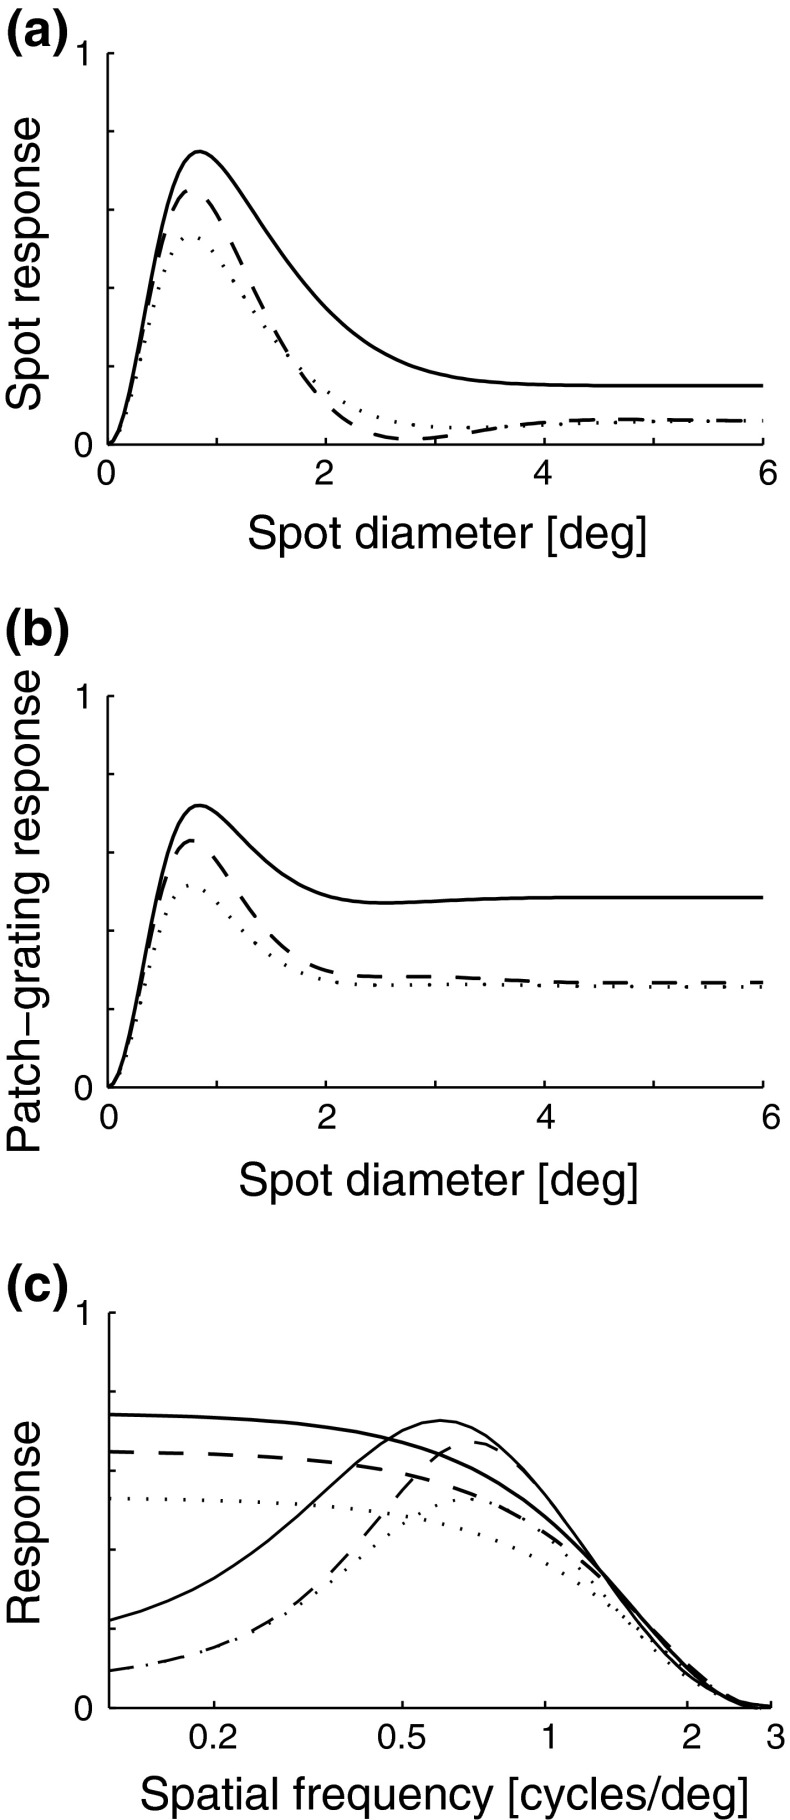
Fig. 6.
Example push-pull inhibitory eDOG model responses for flashing (F
pg(d
pg,0)) and patch-grating (F
pg(d
pg,2πνpg)) spots, cf. Eqs. 38–39. a Flashing-spot response as a function of spot diameter. Solid line: C = 0, i.e., standard DOG. Dashed line: C = −1.5, c = 0.83 deg. Dotted line: Variation of push-pull inhibitory eDOG model with the Gaussian loop-kernel replaced with a function of the type in Eq. 24 with the constant  ,
,  deg
deg  deg and σn = 0; DOG parameters are A
1 = 1, a
1 = 0.25 deg, A
2 = 0.85, and a
2 = 0.83 deg. b Patch-grating response for νpg = 0.3 cycles/deg as a function of spot diameter d
pg for the same models considered in upper left panel. c
Thin lines: Full-field grating response as a function of spatial frequency ν of the grating. Thick lines: Patch-grating response for d
pg = 0.8 deg as a function of spatial frequency νpg of the patch grating. Same models and parameters as in upper panels

