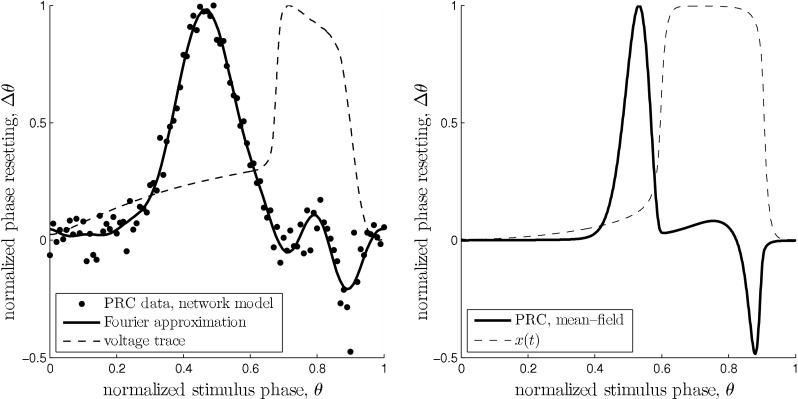
Fig. 5.

Comparison of the two estimates of the slow oscillation’s infinitesimal PRC. The dashed curves show the phase of the unperturbed oscillation in both plots and are in arbitrary units. Left: PRC of the network model for I = 19 nA. Black dots are from direct perturbation of the network at the respective phase θ. The solid curve is a Fourier approximation of the data points of order 7. The voltage trace was obtained by averaging one oscillation period over all pyramidal neurons and subsequent smoothing. Right: PRC of mean field model with  . The parameters where chosen to closely match the PRC of the network model. The model has a similar qualitative behavior over a wide range of parameters. In both models stimulation is ineffective right after an up state. It has the largest impact at the end of the down state right before the transition to the up state. Within the up state, stimulation initially leads to a phase advance, i.e. a reduced up state duration. During the following up–down transition a phase delay is possible resulting in a prolonged up state
